
APPLICATION OF QUANTITATIVE DATA ANALYSIS IN FINANCE
July 14, 2021
Significance of Big data analytics in the healthcare industry
August 9, 2021Investigating and Addressing Publication and Other Biases in Meta-Analysis Research
Introduction to Publication Bias in Systematic Review and Meta-Analysis
Studies that indicate a substantial impact of therapy are more likely than other studies to be published, published in English, referenced by other authors, and published numerous times. As a result, such papers are more likely to be found and included in systematic reviews, introducing Publication Bias. Another primary source of bias is the low methodological quality of research included in a systematic review. Small studies are more susceptible to all of these biases than large studies. The more significant the treatment impact required for the results to be necessary, the smaller the research. Bias in a systematic review may be detected by looking for a correlation between the size of the treatment effect and the size of the study; such correlations can be analysed visually and quantitatively using meta-analysis research, Meta-analysis Scientific Research, and advanced Quantitative Analysis techniques.
Graphical Methods for Detecting Publication Bias in Meta-Analysis
i) Funnel Plots in Statistical Synthesis and Evidence-Based Research
Funnel plots were initially utilised in educational and psychological studies. They’re scattered plots of treatment effects calculated from individual studies (horizontal axis) vs a metric of study size (vertical axis). Because the precision of calculating the underlying treatment effect improves as the sample size of research grows, effect estimates from small studies scatter more widely towards the bottom of the graph, decreasing as the sample size increases. The plot resembles a symmetrical inverted funnel in the absence of bias (fig 1), a key concept in Systematic Review, Statistical Synthesis, and Pooled Data evaluation.
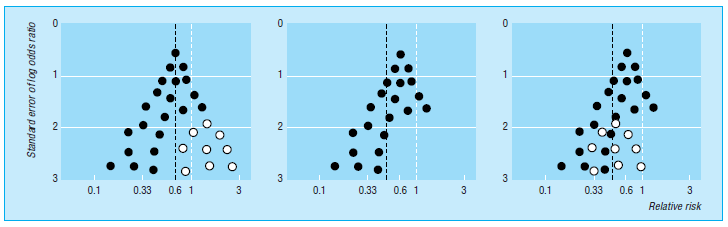
Fig 1 Hypothetical funnel plots [1]
Because smaller trials are demonstrating no statistically significant positive impact of the therapy (open circles in fig 1 (left) go unreported, reporting bias results in an asymmetrical funnel plot (fig 1 (centre) with a gap in the bottom correct. The combined impact from metaanalysis overestimates the treatment’s effect in this case. Smaller studies are done and analysed with less methodological rigour on average than more significant research. Thus, asymmetry may arise by overestimating treatment effects in smaller trials with inferior methodology quality, influencing Effect Size estimation, Weighted Average Effect calculations, and overall Statistical Synthesis outcomes (fig 1 right).
Statistical Methods for Detecting and Correcting Publication Bias
Selection Models in Advanced Meta-Analysis and Meta-Regression
The selection process that decides whether findings are published is modelled using “selection models,” which are based on the premise that the study’s P value impacts its chance of publication. The methods may be expanded to estimate treatment effects adjusted for estimated Publication Bias in Meta-Analysis Research and Bayesian Meta-Analysis frameworks. Still, the lack of strong assumptions about the nature of the selection process necessitates a large number of studies to cover a wide range of P values. According to published applications, a meta-analyses of homoeopathic trials and correction may explain part of the relationship seen in meta-analyses of these research.When publication bias is considered, the “correction” of impact estimates is complex and a source of continuous dispute. The modelling assumptions employed may have a significant impact on the results, particularly under Fixed-Effects Model and Random-Effects Model approaches where Between-Study Variance, Heterogeneity, I² Statistic, and Cochran’s Q Test are evaluated. Many factors can influence the likelihood of a set of results being published, and it’s difficult, if not impossible, to predict them all correctly. Furthermore, Publication Bias is simply one of the plausible reasons for treatment-effects-study-size relationships in Systematic Review and Meta-Analysis. As a result, it’s best to limit statistical approaches to detecting bias rather than fixing it when modelling selection mechanisms.
Conclusion: Interpreting Confidence Interval and Prediction Interval in Meta-Analysis
Investigators should attempt to locate all published research and seek unpublished material when conducting a Systematic Review and Meta-Analysis. The quality of component studies should be scrutinised as well to ensure reliable Quantitative Analysis and appropriate Effect Measure interpretation. Selection models for Publication Bias are most likely to be useful in sensitivity studies examining a meta-analysis’s resilience to potential bias. In most meta-analyses, Funnel Plots should be utilised to offer a visual assessment of whether treatment effect estimates are related to study size in Meta-analysis Scientific Research. Statistical approaches might be used to investigate the evidence for funnel plot asymmetry, Publication Bias, and alternative reasons for study Heterogeneity. However, these techniques are restricted, especially in meta-analyses based on a small number of small researches, where Inverse-Variance Weighting and Meta-Regression may be unstable.
The findings of such meta-analyses should always be taken with a grain of salt. Combining data from fresh trials statistically with a body of faulty research does not eliminate bias in Systematic Review, Pooled Data analysis, or Statistical Synthesis. When a systematic review shows that the evidence to date is unreliable for one or more of the reasons described above, there is presently no agreement to guide clinical practice or future research in Meta-Analysis Research and evidence-based decision making.