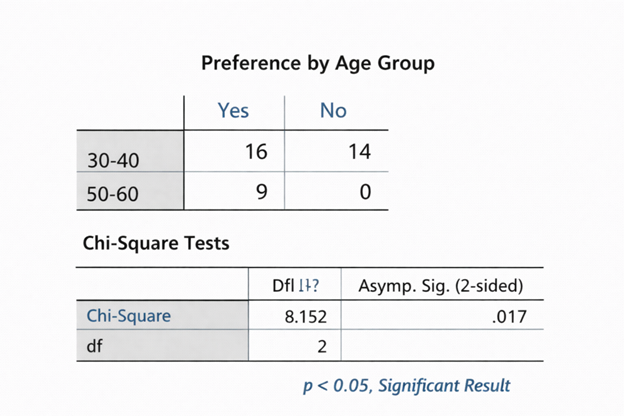
“Statswork provided excellent table interpretation services for my doctoral research. Their explanations of SPSS tables were clear, accurate, and very helpful.”
UK
Data Analysis services
Meta-Analysis Research Services
Data Collection Services
Statistical Programming & Biostatistics services
Data Management Services
Research methodology services
Tool development services
Statistical Interpretation services
Sample Size Calculation Services
Artificial Intelligence and Machine Learning Services
Report generation Services


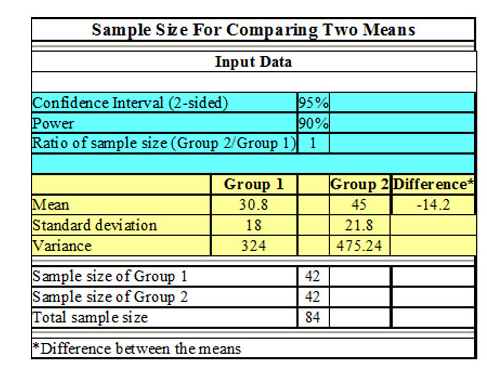
The objective of table interpretation services lies in analyzing findings through tables via various techniques. These services assist researchers in analyzing survey result tables, quantitative tables, and qualitative tables. An appropriate method of interpretation enables proper organization of findings and derivation of accurate conclusions. Table interpretation services are important in academic, business, health care, and marketing research.
Main steps in table interpretation services include:Table interpretation services are employed by organizations and researchers to derive insights that can guide decision-making and planning activities. Good table interpretations will convert any table from research data into useful information.
Common applications of table interpretations are:
Our table interpretations will help you get valid research information at Statswork.


UK

UK

UK

UK