
- Services
- Data Analysis services
- Sample Work
Data Analysis services
- Secondary Qualitative Research Services
- Secondary Quantitative Research Services
- Meta-Analysis Research services
- Sample Work

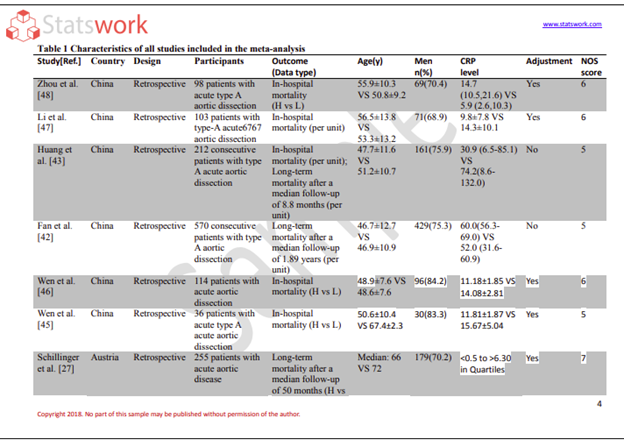
Meta-Analysis Research Services
- Data Collection Services
- Sample Work
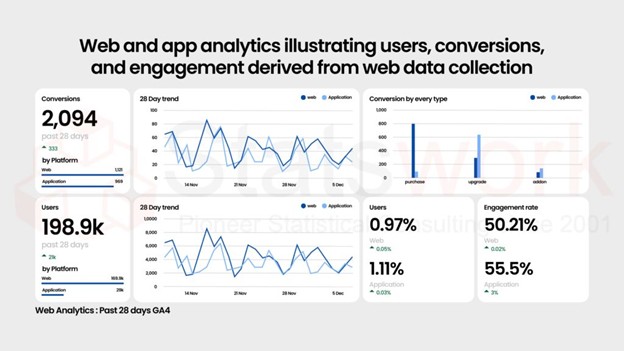
Data Collection Services
- Statistical & Biostatistics services
- Sample Work
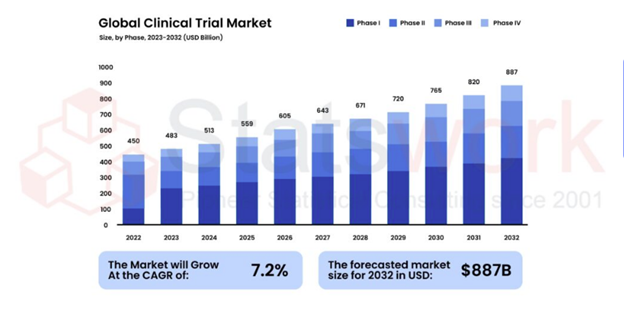
Statistical Programming & Biostatistics services
- Data Management Services
- Sample Work
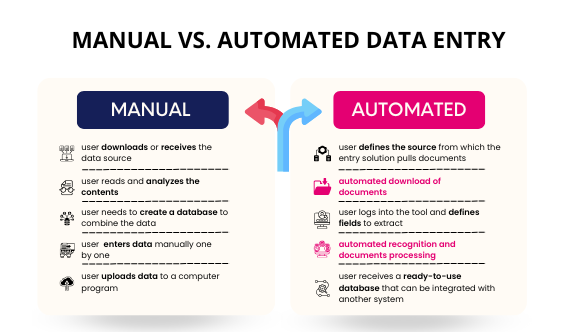
Data Management Services
- Research methodology services
- Sample Work
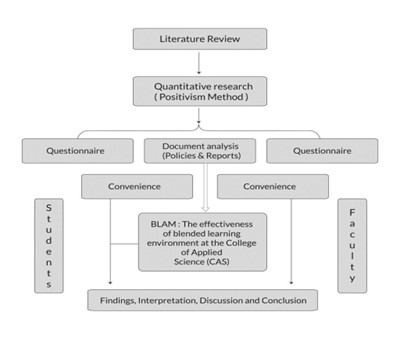
Research methodology services
- Tool Development Services
- Sample Work
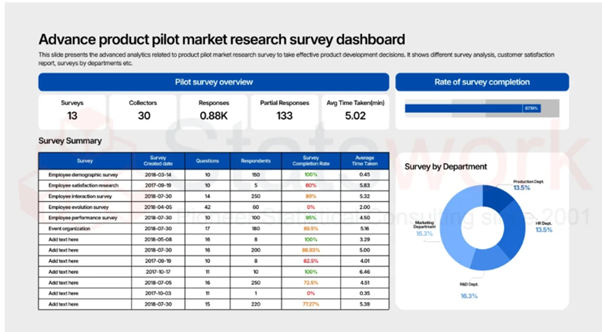
Tool development services
- Statistical Interpretation services
-
Statistical Interpretation services
- Sample Work
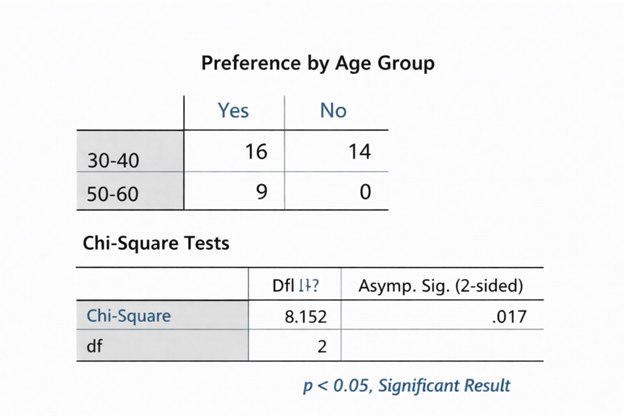
Statistical Interpretation services
-
- Sample Size Calculation Services
-
Sample Size Calculation Services
- Sample Work
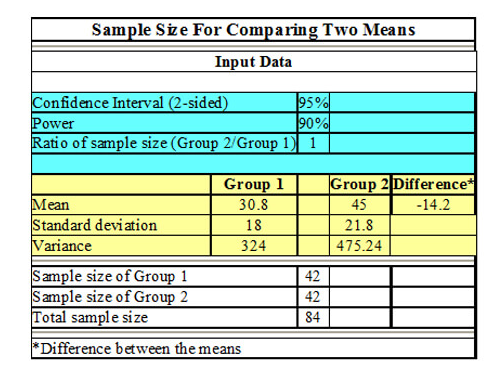
Sample Size Calculation Services
-
- AI & ML Services
-
Artificial Intelligence and Machine Learning Services
- Sample Work
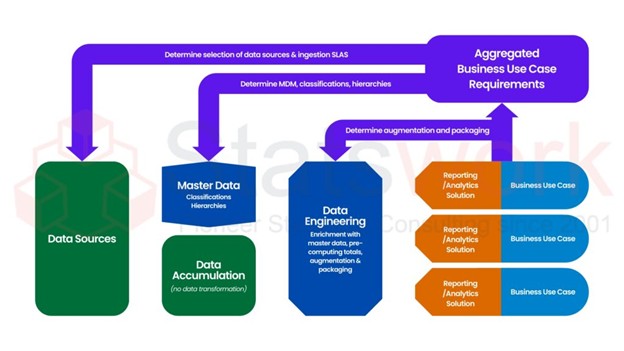
Artificial Intelligence and Machine Learning Services
-
- Meaningful Visualization Services
- Thought Leadership Services
- Report Generation Services
-
Report generation Service
- Sample Work

Report generation Services
-
- Data Analysis services
- Industries
- About Us
- Blog
- Insights
- Contact Us
- Services
- Data Analysis services
- Sample Work
Data Analysis services
- Secondary Qualitative Research Services
- Secondary Quantitative Research Services
- Meta-Analysis Research services
- Sample Work
Meta-Analysis Research Services
- Data Collection Services
- Sample Work
Data Collection Services
- Statistical & Biostatistics services
- Sample Work
Statistical Programming & Biostatistics services
- Data Management Services
- Sample Work
Data Management Services
- Research methodology services
- Sample Work
Research methodology services
- Tool Development Services
- Sample Work
Tool development services
- Statistical Interpretation services
-
Statistical Interpretation services
- Sample Work
Statistical Interpretation services
-
- Sample Size Calculation Services
-
Sample Size Calculation Services
- Sample Work
Sample Size Calculation Services
-
- AI & ML Services
-
Artificial Intelligence and Machine Learning Services
- Sample Work
Artificial Intelligence and Machine Learning Services
-
- Meaningful Visualization Services
- Thought Leadership Services
- Report Generation Services
-
Report generation Service
- Sample Work
Report generation Services
-
- Data Analysis services
- Industries
- About Us
- Blog
- Insights
- Contact Us
How to Choose the Right Machine Learning Algorithm for Your Business Problem
Meta Analysis Service
Recommended Reads
Contact us
Summary:
Selecting the best ML algorithm cannot be achieved simply by choosing the one that is most accurate. The 10 steps discussed in this blog are related to objectives of the business, nature of the problem, properties of the data, benchmarking against other models, cost metrics, validating and tuning the parameters of the algorithm, interpretation and compliance, limitations of the algorithm, and deploying the algorithm, among others. Furthermore, the post gives an illustration of the use of business costs and thresholds to determine which model to select.
How to Choose the Right Machine Learning Algorithm for Your Business Problem
No machine learning algorithm is best for every problem. The No Free Lunch results show that, when performance is averaged across all possible problem distributions under their assumptions, an algorithm’s gains on some problems are offset by losses on others (Wolpert, 1996) [15]. The practical lesson is to match the method to the business objective, data-generating process and operating constraints. Churn prediction, demand forecasting, customer segmentation, fraud detection and text classification may require different algorithms, evaluation metrics and validation strategies.
This article explains how to select an appropriate algorithm for a business application and demonstrates why the model with the highest headline accuracy may not deliver the greatest business value.
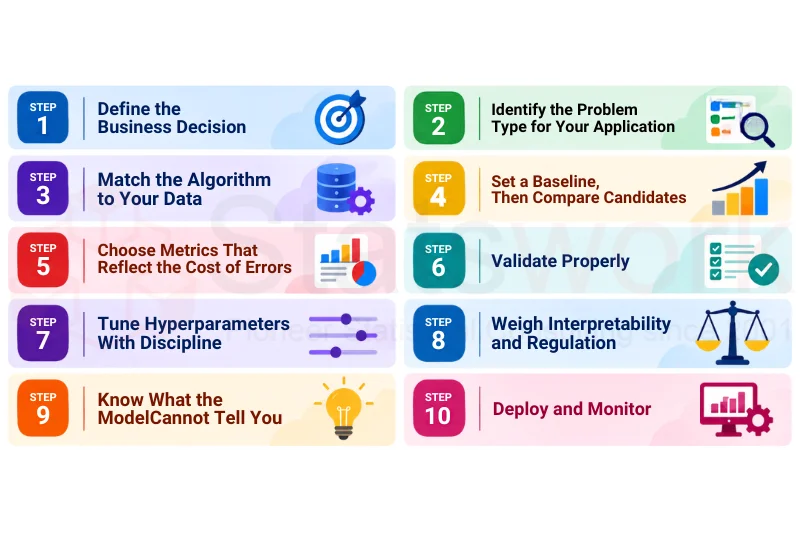
Step 1: Define the Business Decision
Algorithm selection should begin with the business decision the model is intended to support. Before comparing algorithms, answer the following questions:
- What decision should be influenced by the model?
- What is the target variable, and when does it become known?
- What information is available at the time of prediction?
- What are the costs of different types of errors?
- Should predictions be interpretable for customers/auditors/regulators?
- How fast should predictions be provided?
Step 2: Identify the Problem Type for Your Application
| Application | Problem type | Starting candidates |
|---|---|---|
| Revenue prediction | Regression | Linear regression (baseline), gradient boosting |
| Churn prediction | Classification | Logistic regression (baseline), gradient boosting |
| Customer segmentation | Clustering | K-means, hierarchical clustering |
| Fraud detection | Anomaly detection | Isolation Forest, robust statistical thresholds |
| Demand forecasting | Forecasting | ETS/ARIMA (baseline), gradient boosting with lag features |
| Support-ticket classification | Text classification | Pretrained embeddings with a linear classifier |
| Offer personalization | Sequential decision | A/B testing, contextual bandits, reinforcement learning |
These are starting points, not rules. Reinforcement learning is most relevant when decisions are sequential, actions affect later states or available information, and the objective is to optimise delayed or cumulative reward. For many single-step choices, controlled experiments or contextual bandits may be simpler to build, evaluate and govern.
Step 3: Match the Algorithm to Your Data
| Characteristic of the data | Implication |
|---|---|
| Rare event | Evaluation: use precision, recall and PR-AUC where appropriate. Modelling: consider class weighting or resampling within training folds. Decision: optimise the operating threshold against error costs and capacity. |
| Little data and many features | Favor regularization models; feature selection within CV |
| Time ordered data | Test on the future time periods, not randomly split |
| Missing data | Assess whether missingness is plausibly MCAR, MAR or MNAR before choosing an imputation strategy. A missingness indicator may itself carry predictive information; fit all preprocessing within the training data to avoid leakage. |
Studies of typical structured tabular datasets have found that tree-based ensemble models often match or outperform deep learning models, frequently with lower modelling and computational complexity (Grinsztajn et al., 2022). Results still depend on the dataset, representation, tuning and evaluation design.
Partitioning methods such as k-means can return clusters even when the underlying structure is weak or not meaningful. Retain clusters only when they are stable under resampling, interpretable, distinct on relevant variables and useful for the intended decision [4].
Step 4: Set a Baseline, Then Compare Candidates
Begin with a straightforward method like logistic regression or naive forecast. After that, try out two or three different approaches. A complicated approach is justified only if it proves superior to the initial one by an amount that really counts for your business.
Step 5: Choose Metrics That Reflect the Cost of Errors
- Rare positive outcomes: precision-recall curves are often more informative than ROC curves when classes are highly imbalanced and performance on the positive class matters. ROC-AUC can still be useful, but it may look favourable even when the deployed threshold produces many false alarms (Saito & Rehmsmeier, 2015) [14].
- Regression: MAE is directly interpretable in the outcome’s units. RMSE is also reported in those units after taking the square root, but it weights large errors more heavily. R-squared does not show whether the absolute error is small enough for the business decision.
- Probability: if predictions with probabilities are used for decision making, check calibration of scores. There may be some models such as boosted trees producing biased scores (Niculescu-Mizil & Caruana, 2005) [10].
Worked Example: The Most Accurate Churn Model Can Be the Wrong Choice
The figures below are illustrative, not client results.
A company has 10,000 customers, and 5% are expected to churn. Contacting a customer with a retention offer costs $50. The intervention succeeds 40% of the time and preserves $600 in value when it succeeds.
Accuracy is deceptive. Predicting that none of the customers will churn will be right 95% of the time and catch no churners.
What’s the breakeven point? It’s worth contacting the customer only if:
P(churn) × 0.40 × $600 > $50
The predicted churn rate must therefore exceed 21%.
Compare thresholds:
| Threshold | Flagged | Churners caught | Recall | Precision |
|---|---|---|---|---|
| Contact everyone | 10,000 | 500 | 100% | 5% |
| Low threshold | 1,400 | 350 | 70% | 25% |
| Higher threshold | 625 | 250 | 50% | 40% |
Net value = (churners caught × 0.40 × $600) − (customers flagged × $50)
The economics favour the higher threshold despite its lower recall. At the low threshold, net value = (350 x 0.40 x $600) – (1,400 x $50) = $84,000 – $70,000 = $14,000. At the higher threshold, net value = (250 x 0.40 x $600) – (625 x $50) = $60,000 – $31,250 = $28,750. The higher threshold therefore produces $14,750 more net value, slightly more than double, while contacting 775 fewer customers.
Compare models with the same care. For example, suppose gradient boosting achieves a PR-AUC of 0.44 and logistic regression achieves 0.41, while fold-to-fold variation is approximately 0.03-0.04. The observed gap may reflect sampling variation rather than a dependable improvement. Because cross-validation folds use overlapping training data, a conventional independent-samples t-test can be overly confident (Nadeau & Bengio, 2003). Before choosing the more complex model, examine uncertainty across resamples, stability, calibration and net business value at the intended operating threshold.
Step 6: Validate Properly
- Reserve the test set for final, unbiased performance evaluation after model selection and tuning are complete.
- When conducting hyperparameter tuning, ensure the use of nested cross-validation, because otherwise, the reuse of the same data will inflate the estimate of the model’s performance (Cawley & Talbot, 2010).
- When dealing with sequential data, train with the previous data, and validate with the future data (Hyndman & Athanasopoulos, 2021).
- Find leaks, where the model uses information that is not available for predicting, such as the “cancellation reason” column (Kaufman et al., 2012) [9].
Step 7: Tune Hyperparameters With Discipline
Random search can be more efficient than exhaustive grid search when only a subset of hyperparameters strongly influences performance (Bergstra & Bengio, 2012) [1]. Repeatedly tuning against the same validation data also increases the risk of overfitting the selection process.
Step 8: Weigh Interpretability and Regulation
For important decisions, use interpretable models where appropriate. The post-hoc explanation of the black box could be misleading (Rudin, 2019) [13].
The SHAP value is the explanation for the prediction (Lundberg & Lee, 2017). However, SHAP values explain the model rather than the real cause in the real world [2].
Legal and governance duties depend on the use case, the organisation’s role and the effect of the decision. GDPR Article 22 concerns decisions based solely on automated processing that produce legal effects or similarly significant effects; where an exception under Article 22(2)(a) or (c) is used, safeguards include the right to obtain human intervention, express a point of view and contest the decision. The EU AI Act applies on a staged basis. Although its general application date is 2 August 2026, the current Article 113 provides later application dates for key high-risk AI-system requirements in Chapter III, Sections 1–3: 2 December 2027 for systems classified as high-risk under Article 6(2) and Annex III, and 2 August 2028 for systems classified under Article 6(1) and Annex I, subject to the specific provisions and exceptions in the Regulation. Systems classified as high-risk may be subject to requirements concerning risk management, data governance, technical documentation, transparency, human oversight, accuracy, robustness and cybersecurity. Teams should therefore determine the system’s classification, their regulatory role and the provisions currently applicable rather than assuming every machine-learning model requires the same governance or human-in-the-loop design. [11] [12].
Step 9: Know What the Model Cannot Tell You
A churn model may rank support-ticket activity as an important predictor. That association does not show that reducing the number of recorded tickets will reduce churn; ticket volume may instead signal an underlying product or service problem [5].
A churn propensity model estimates which customers are at elevated risk based on observed patterns. It does not by itself establish what causes churn, and it does not answer which customers will change their behaviour because of a particular intervention. If the decision is whom to target with a retention offer, uplift modelling or heterogeneous treatment-effect estimation can estimate incremental response, provided the analysis is supported by randomised experiments or a credible causal-inference design (Hernan & Robins, 2020).
Step 10: Deploy and Monitor
Deployment should include a documented monitoring and response plan, not only a retraining schedule. Track input-data drift, concept or performance drift, calibration drift, subgroup performance, missingness, latency, failures and the business value produced at the operating threshold. Define alert limits, owners and retraining or rollback triggers in advance; retain model, data and feature-pipeline versions so decisions are reproducible and changes can be audited. Because labels may arrive late, combine leading operational indicators with periodic outcome-based evaluation (Gama et al., 2014) [3].
When to Bring In Statswork
Algorithm selection becomes difficult when there are uncommon events, time-varying data, high dimensional inputs, limited latency requirements or regulated decision making. In such cases, validation or thresholding mistakes lead to financial losses which go unnoticed.
The statisticians at Statswork support companies by:
- Defining the decision, objective and costs of an error
- Checking data quality, completeness and leakage
- Evaluating candidate algorithms using statistical validation
- Model tuning, probability calibration and cost-based thresholding
- Interpreting models and documenting them for auditing purposes
What you receive: a model comparison report, validation results, an interpretability summary, and a deployment and monitoring recommendation.
Share your dataset and business objective to request an algorithm-selection assessment from Statswork.
Frequently Asked Questions (FAQs)
Define the decision and the cost of each error, identify the problem type, and set a baseline. Then compare candidates using metrics and validation that reflect real use.
For many tabular datasets, tree-based ensembles are strong candidates and may match or outperform deep learning with lower modelling and computational complexity. Pretrained deep-learning models are often effective for text, images and audio, but the best choice still depends on data volume and quality, compute, latency, interpretability, accuracy and deployment constraints.
When the outcome is rare, a model that predicts “no” for everyone scores high accuracy while catching nothing. Use precision, recall, PR-AUC and cost-based evaluation instead.
Key Takeaway
Select algorithms on evidence, not popularity: a clear business decision, suitable metrics, honest validation and ongoing monitoring.
References:
- Bergstra, J., & Bengio, Y. (2012). Random search for hyper-parameter optimization. Journal of Machine Learning Research, 13, 281-305. https://www.jmlr.org/papers/v13/
- Cawley, G. C., & Talbot, N. L. C. (2010). On over-fitting in model selection and subsequent selection bias in performance evaluation. Journal of Machine Learning Research, 11, 2079-2107. https://www.jmlr.org/papers/v11/caw
- Gama, J., Zliobaite, I., Bifet, A., Pechenizkiy, M., & Bouchachia, A. (2014). A survey on concept drift adaptation. ACM Computing Surveys, 46(4), Article 44. https://doi.org/10.1145/2523813
- Grinsztajn, L., Oyallon, E., & Varoquaux, G. (2022). Why do tree-based models still outperform deep learning on typical tabular data? NeurIPS 2022 Datasets and Benchmarks Track. https://proceedings.neurips.cc/paper
- Hernan, M. A., & Robins, J. M. (2020). Causal inference: What if. Chapman & Hall/CRC. https://www.hsph.harvard.edu/
- Hyndman, R. J., & Athanasopoulos, G. (2021). Forecasting: Principles and practice (3rd ed.). OTexts. https://otexts.com/fpp3/
- Kaufman, S., Rosset, S., Perlich, C., & Stitelman, O. (2012). Leakage in data mining: Formulation, detection, and avoidance. ACM Transactions on Knowledge Discovery from Data, 6(4), Article 15. https://doi.org/10.1145/2382577.2382
- Lundberg, S. M., & Lee, S.-I. (2017). A unified approach to interpreting model predictions. Advances in Neural Information Processing Systems, 30. https://proceedings.neurips.cc/
- Nadeau, C., & Bengio, Y. (2003). Inference for the generalization error. Machine Learning, 52, 239-281. https://doi.org/10.1023/A:10240686
- Niculescu-Mizil, A., & Caruana, R. (2005). Predicting good probabilities with supervised learning. Proceedings of the 22nd International Conference on Machine Learning. https://doi.org/10.1145/1102351.1102430
- Regulation (EU) 2016/679 (General Data Protection Regulation), Article 22. https://eur-lex.europa.eu/eli/reg/2016/679/oj
- Regulation (EU) 2024/1689 (Artificial Intelligence Act). https://eur-lex.europa.eu/eli/reg/2024/1689/oj
- Rudin, C. (2019). Stop explaining black box machine learning models for high stakes decisions and use interpretable models instead. Nature Machine Intelligence, 1(5), 206-215. https://doi.org/10.1038/s42256-019-0048-x
- Saito, T., & Rehmsmeier, M. (2015). The precision-recall plot is more informative than the ROC plot when evaluating binary classifiers on imbalanced datasets. PLOS ONE, 10(3), e0118432. https://doi.org/10.1371/journal.pone
- Wolpert, D. H. (1996). The lack of a priori distinctions between learning algorithms. Neural Computation, 8(7), 1341-1390. https://doi.org/10.1162/neco.1996.8.