
APPLICATION OF TIME SERIES ANALYSIS IN FINANCIAL ECONOMICS
November 1, 2019
Qualitative Research methodology in healthcare/hospitals
November 11, 2019Multilevel Model Comparison and Statistical Diagnostics for Reliable Meta-Analysis Research
Meta Analysis Service
- Introduction
- Understanding Multilevel Models in Meta-Analysis
- Importance of Multilevel Model Comparison
- The most important benefits of model comparison are as follows:
- Statistical Diagnostics for Model Validation
- Residual Diagnostics in R for Multilevel Models
- Using Cook's Distance in Multilevel Analysis
- How Meta Analysis Services Support Advanced Modeling
- Conclusion
Recommended Reads
Contact us
Summary
Model comparison multilevel is a technique that allows the researcher to determine which is the appropriate hierarchical model to analyze a meta-analysis with a nested and hierarchical structure. By the hierarchical linear model’s comparison and the mixed effects model’s comparison organizations can obtain higher precision and less bias in the result of research. The complete statistical diagnostics like multilevel analysis by using the Cook’s distance and residuals diagnostics in Rare essential for checking the model accuracy and the influence of different observations in the results. Professional Meta Analysis Services are crucial to allow organizations to convert data into decision making information.Introduction
We, organizations, health services providers, researchers, and consulting firms are increasingly using sophisticated statistical methods to make sense out of complex data. While working on studies with extensive data or conducting meta-analysis projects, data structures are often hierarchical, that is observations can be nested within varying levels. Regression methods may ignore these dependencies and therefore render a wrong analysis [1].
The way to approach it is to use multilevel model comparison. Multi-level model comparison consists of comparing several hierarchical models to find the model that best fits the nested data structure by conducting numerous statistical diagnostic tests. Statswork Meta Analysis services enable organizations to apply complex modeling to develop research-based conclusions.
Understanding Multilevel Models in Meta-Analysis
The multi-level model is a statistical technique that applies to analysis of hierarchical data, i.e. Data in which different sources of variance exist, which could occur in a meta-analysis study by regions, organizations, research institutes or periods [2]. The main object is that the levels are considered to increase the precision of statistical estimations.
- Potential uses include
- Health outcome evaluation
- Academic performance study
- Clinical trial meta-analysis
- Business performance benchmarking
- Marketing and customer behavior research
- Multi-site organizational study
Through hierarchical linear model, we can explore inter-group relationships along with within-group relationships.
Importance of Multilevel Model Comparison
Appropriate model selection is vital to ensuring valid conclusions can be drawn. Researchers often attempt a variety of models to understand what structure is most appropriate for the data.
Key Benefits of Model Comparison
| Factor | Business Value |
| Increased Accuracy of Model | Improved prediction and decision making |
| Reduced Statistical Bias | Reliable outcomes of research |
| Better estimate of Variance | Understanding the group effects reliably |
| Increased Certainty of Conclusion | Increased reliability and confidence in findings |
Appropriate model selection is vital to ensuring valid conclusions can be drawn. Researchers often attempt a variety of models to understand what structure is most appropriate for the data [2].
The most important benefits of model comparison are as follows:
The use of comparative multilevel models enables researchers to determine if the addition of random effects or hierarchy can improve upon a model.
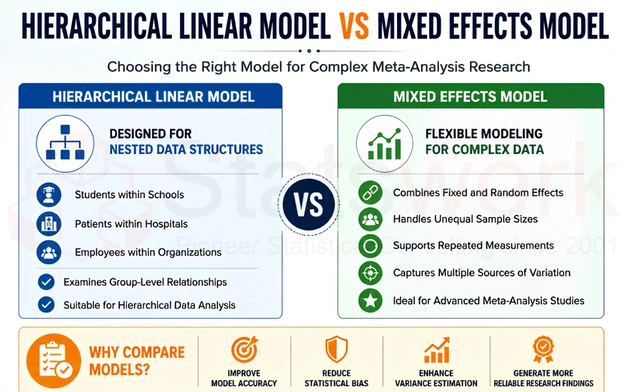
Hierarchical Linear Model vs Mixed Effects Model
There seems to be confusion among many organizations about what models are appropriate in the analysis section, more specifically between HLM and mixed effects models.
Hierarchical Linear Model
A hierarchical linear model specifically looks at nested structures, or when observations at the lower-level fall within a higher-level group.
The following are few examples:
- Students in a school
- Patients in a hospital
- Employees within an organization
Mixed Effects Model
The mixed effects model has been shown to combine both fixed effects and random effects to better determine variations among groups.
Its strengths are that it is a lot more flexible than HLM and is better at handling unequal numbers of data or random variations and dealing with repeat measures [3].
For meta-analysis research involving higher complexity mixed effects models are more likely to work better as there is more than one source of variation.
Statistical Diagnostics for Model Validation
However, the development of the model itself is only the initial stage. Correct statistical diagnostics are needed to ascertain if the assumptions made in the model are being held true, and that the results from the model can be relied upon.
The standard diagnostics methods for modeling have been reviewed and are as follows:
Residual analysis
Residual analysis studies the discrepancy between the observed values and predicted values of the response variable from the model [4].
It is important to investigate:
- Normality of residuals
- Homoscedasticity
- Independence of errors
- pattern of the distribution of the residuals
- Influence Analysis
Influential observations can be troublesome, as the result of the parameters might be biased. The diagnostics method identifies:
Outliers
- High leverage observation
- Extreme residuals
- Random effect evaluation
Assessing the random effect parameters helps to see if the use of hierarchical models has been worthwhile or not
Residual Diagnostics in R for Multilevel Models
However, modeling itself is just one step forward. The statistically sound diagnosis has to be run to examine whether the assumption on which the model is built up is indeed maintained, and thus, the outcome from the model can be interpreted with confidence.
The commonly used diagnostics methods for modeling have been reviewed and listed as below:
Residual Analysis
The residual analysis refers to analysis on the difference between the observation data points and values predicted from the model on the response variable.
In analyzing the residual, it’s essential to check:
- Normality of the residuals
- Homoscedasticity
- Independence of the errors
- distribution pattern of residuals
- Influence analysis [5]
It might be problematic if there exist an observation that is influential, because the estimated parameters might be biased. The methods can help identify:
Outliers
- Observations with high leverage
- Observations with extreme residuals
- Random Effects Evaluation
The estimate of the random effects parameters is used to check whether using the hierarchical model is a beneficial approach or not.
Using Cook's Distance in Multilevel Analysis
The assessment of Cook’s distance multilevel is one of the most powerful influence measures in hierarchical modeling. Cook’s distance measures how sensitive are the estimated values of model parameters to individual cases in the data set.
Cook’s Distance Key points
- Help find problematic cases
- Results in a more robust model
- Minimize the biases in parameter estimates
- Provide more trustworthy and reliable research results.
Main result
- Findings influencing points of interest
- Increased confidence in clustered influence measurement
- Enhance confidence in findings
- Increases reproducibility.
Together with other diagnostic measures Cook’s distance is an essential part to build a good and stable model.
How Meta Analysis Services Support Advanced Modeling
Evidence-based research organizations need more than just statistical hypothesis testing. Organizations must employ complex, multi-level models that can adequately reflect and illustrate complex data structures [4].
Our Meta Analysis Services Include:
- Multilevel Model Building and development
- HLM statistical analysis
- Mixed effects model estimation
- Robust statistical Diagnostics
- Residual Diagnostics (in R)
- Cook’s Distance multilevel analysis
- Statistical model testing and validation
- Publication-Quality statistical reporting
Conclusion
Analyzing clustered, nested data is pervasive in research, and multilevel model comparison must be applied correctly [5]. There are several statistical diagnoses that are important in hierarchical linear models or mixed-effects models. Among other things, this type of model comparison can assist the researcher by using Cook’s distance multilevel analysis and residuals diagnostics in R to account for influential points.
Through the professional in statswork , agencies can effectively draw on these statistics to establish believable arguments, improve conclusions and develop conclusive decisions.
Reference:
- Veroniki, A. A., Tsokani, S., Rücker, G., Mavridis, D., & Takwoingi, Y. (2022). Challenges in comparative meta-analysis of the accuracy of multiple diagnostic tests. Meta-Research, 299-316. https://link.springer.com/protocol/10.1007/978-1-0716-1566-9_18
- Macaskill, P., Takwoingi, Y., Deeks, J. J., & Gatsonis, C. (2023). Understanding meta‐Cochrane handbook for systematic reviews of diagnostic test accuracy, 203-247. https://onlinelibrary.wiley.com/doi/full/10.1002/erv.3163
- Rousou, X., Meletis, E., Furuya-Kanamori, L., Solomakos, N., Kostoulas, P., & Doi, S. A. (2026). A comparison of frequentist and Bayesian methods for meta-analysis of diagnostic test accuracy studies. Epidemiology & Infection, 1-21. https://onlinelibrary.wiley.com/doi/full/10.1002/jrsm.1634
- Cassioli, E., Lucherini Angeletti, L., Rossi, E., Selvi, G., Riccardi, E., Siviglia, S., … & Castellini, G. (2025). Leptin Levels in Acute and Recovered Eating Disorders: An Arm‐Based Network Meta‐European Eating Disorders Review, 33(3), 525-537. https://www.cambridge.org/core/journals/epidemiology-and-infection/article/comparison-of-frequentist-and-bayesian-methods-for-metaanalysis-of-diagnostic-test-accuracy-studies/22E9019E6C21F9C26ACFB78BDC956035
- Kuo, K. M., Wu, W. S., & Chang, C. S. (2025). A meta-analysis of the diagnostic test accuracy of artificial intelligence for predicting emergency department revisits. Journal of Medical Systems, 49(1), 81. https://link.springer.com/article/10.1007/s10916-025-02210-2