
- Services
- Data Analysis services
- Sample Work
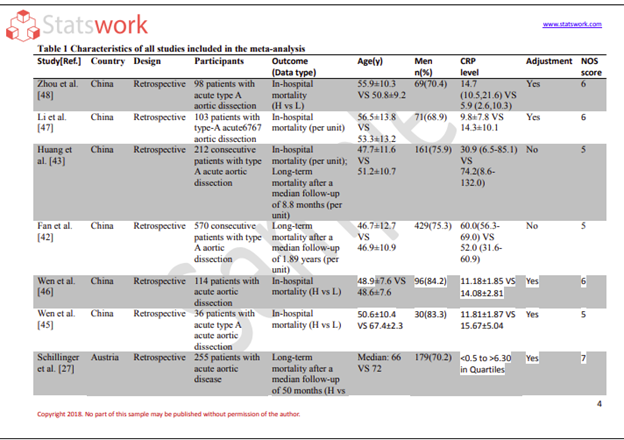
Data Analysis services
- Secondary Qualitative Research Services
- Secondary Quantitative Research Services
- Meta-Analysis Research services
- Sample Work
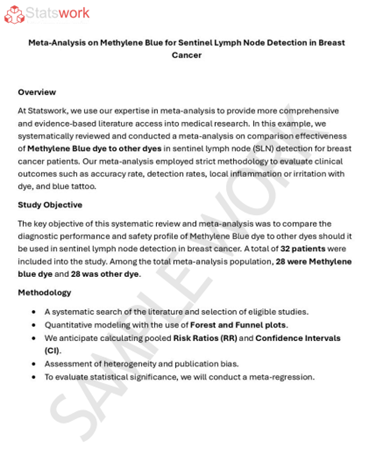
Meta-Analysis Research Services
- Data Collection Services
- Sample Work
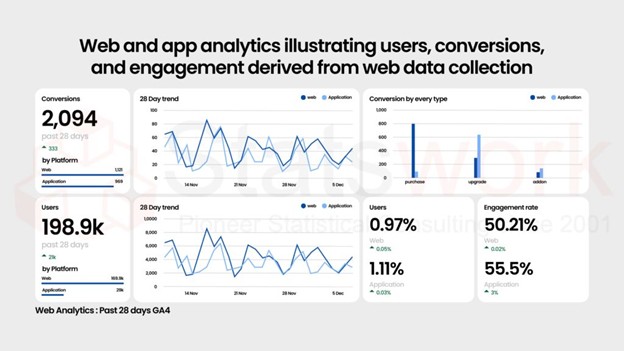
Data Collection Services
- Statistical & Biostatistics services
- Sample Work
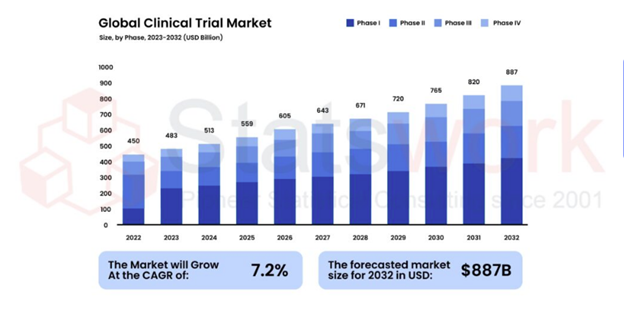
Statistical Programming & Biostatistics services
- Data Management Services
- Sample Work
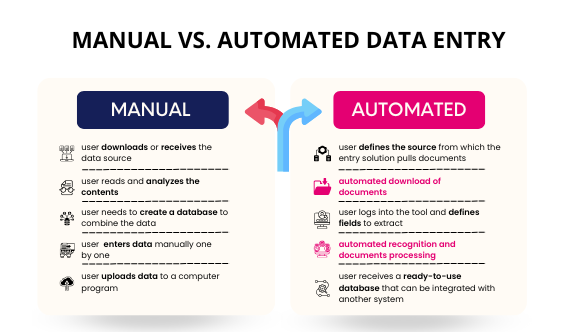
Data Management Services
- Research methodology services
- Sample Work
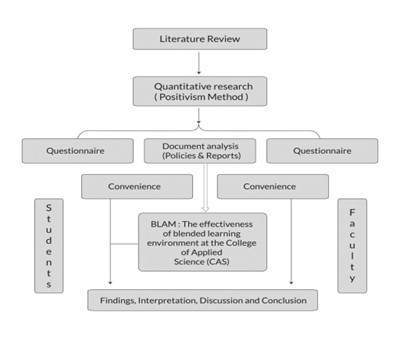
Research methodology services
- Tool Development Services
- Sample Work
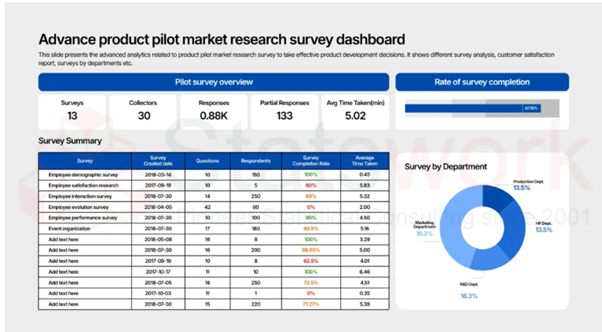
Tool development services
- Statistical Interpretation services
-
Statistical Interpretation services
- Sample Work
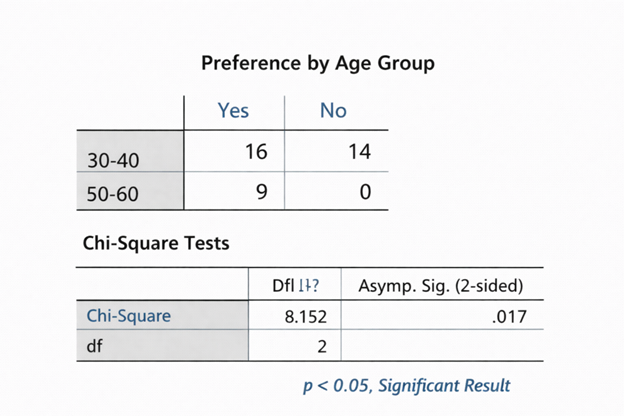
Statistical Interpretation services
-
- Sample Size Calculation Services
-
Sample Size Calculation Services
- Sample Work
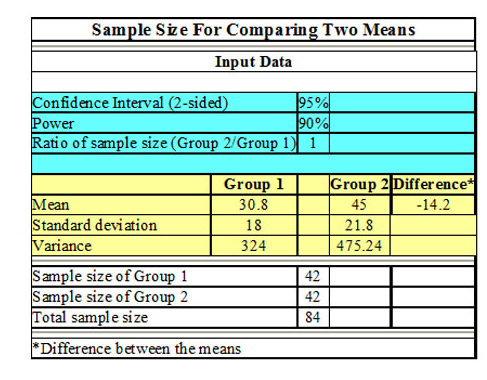
Sample Size Calculation Services
-
- AI & ML Services
-
Artificial Intelligence and Machine Learning Services
- Sample Work
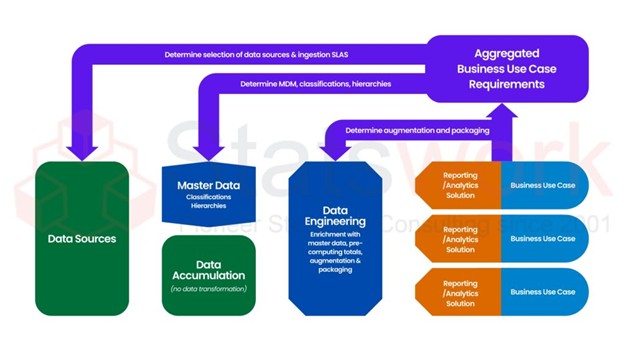
Artificial Intelligence and Machine Learning Services
-
- Meaningful Visualization Services
- Thought Leadership Services
- Report Generation Services
-
Report generation Service
- Sample Work
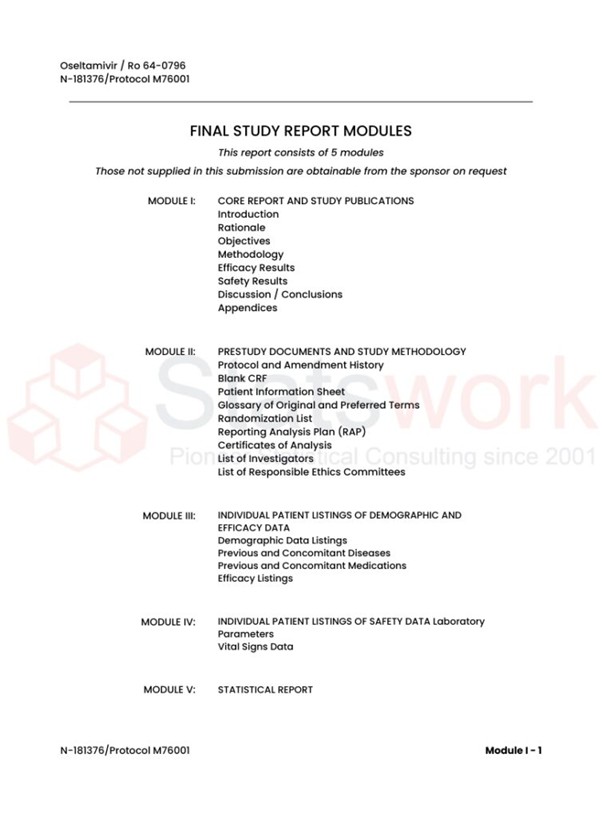
Report generation Services
-
- Data Analysis services
- Industries
- About Us
- Blog
- Insights
- Contact Us
- Services
- Data Analysis services
- Sample Work
Data Analysis services
- Secondary Qualitative Research Services
- Secondary Quantitative Research Services
- Meta-Analysis Research services
- Sample Work
Meta-Analysis Research Services
- Data Collection Services
- Sample Work
Data Collection Services
- Statistical & Biostatistics services
- Sample Work
Statistical Programming & Biostatistics services
- Data Management Services
- Sample Work
Data Management Services
- Research methodology services
- Sample Work
Research methodology services
- Tool Development Services
- Sample Work
Tool development services
- Statistical Interpretation services
-
Statistical Interpretation services
- Sample Work
Statistical Interpretation services
-
- Sample Size Calculation Services
-
Sample Size Calculation Services
- Sample Work
Sample Size Calculation Services
-
- AI & ML Services
-
Artificial Intelligence and Machine Learning Services
- Sample Work
Artificial Intelligence and Machine Learning Services
-
- Meaningful Visualization Services
- Thought Leadership Services
- Report Generation Services
-
Report generation Service
- Sample Work
Report generation Services
-
- Data Analysis services
- Industries
- About Us
- Blog
- Insights
- Contact Us
The Role of Forest Plots in Meta-Analysis and Systematic Reviews
Meta Analysis Service
Recommended Reads
Contact us
Summary:
Forest plots transform complex meta-analysis results into clear, publication-ready visual evidence, helping researchers, regulators, and reviewers interpret findings with confidence. Professional forest plot services improve accuracy, ensure journal and regulatory compliance, and reduce analysis time through expert statistical support. Statswork delivers validated, high-quality forest plots that strengthen systematic reviews, clinical trial reporting, and evidence-based decision-making.
The key factor for every pharmaceutical or biotechnology submission is whether the evidence supports it. When regulatory agencies, potential investors or peer reviewers open the meta-analysis, what they pay attention to at first is not the p-value listed on page 40 — it is the forest plot. In a split second, they get an answer: Is the pooled evidence convincing enough? For research organizations struggling against time to meet the submission deadline, such visual representation plays a critical role [1]. If it fails, not only will precious time be wasted, but credibility and reputation as well. All efforts to perform a proper analysis of the clinical trials will be lost.
This is the reason why more research organizations are looking for forest plot assistance and statistical consulting.
Why Forest Plots Are Central to Evidence Synthesis
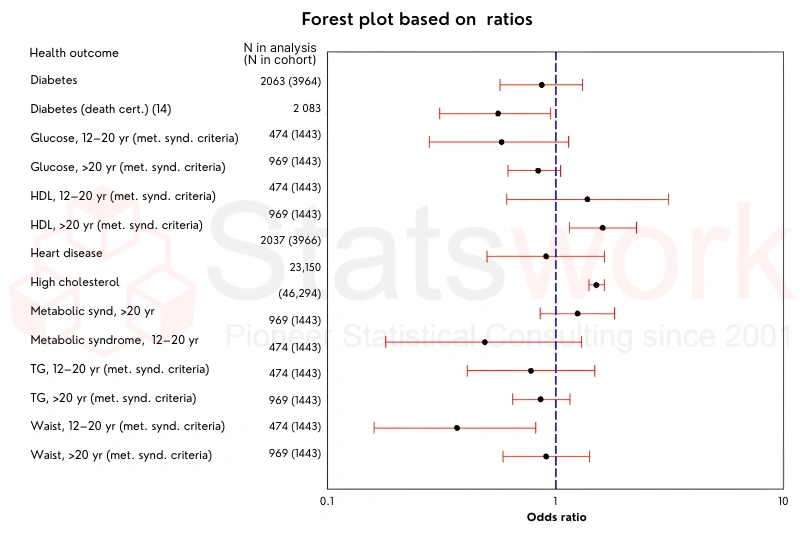
A forest plot takes all these dozens of studies, each with its own effect size, confidence intervals, and weighting factor, and turns them into one tidy forest plot. Rather than having to compare twenty tables, the forest plot gives reviewers instant access to information about consistency of effect sizes, areas of uncertainty, and the overall picture of results in a second. This overall result shows up as a diamond: the one number that your evidence synthesis project has been striving for.
For pharma and biotech teams, this is not a matter of academic interest. Forest plots become key elements of systematic reviews submitted to government regulators, peer-reviewed journals, and even R&D project committees within companies [2]. Any misinterpretation of confidence intervals or inconsistencies between effect measures can silently sabotage even a great dataset – and none of us wants to be found out in peer review. The success of evidence synthesis hinges on this graphic alone.
Common Challenges Research Teams Face
Even experienced clinical and epidemiological teams run into the same friction points when building a forest plot tool output in-house:
| Problems | What Is Not Right |
| Inconsistency in measurements | The use of odds ratios alongside risk ratios in different papers leads to inconsistent comparisons. |
| Unmeasured heterogeneity | The degree of variability among different studies is unclear, making interpretation difficult for reviewers. |
| Too crowded visuals | Too many data points on the same graph create confusion and reduce readability. |
| Non-compliance | Not all graphs comply with the formatting requirements of journals and regulatory agencies, leading to forest plot compliance issues. |
| Deadline pressures | Graph development and validation must be completed alongside other trial-related tasks, creating time constraints. |
These aren’t small hiccups. In clinical and epidemiology contexts, a flawed plot can delay publication, invite regulatory scrutiny, or weaken a grant proposal exactly when precision matters most [3].
How Forest Plot Services Deliver Speed and Accuracy
That is exactly the point where professional forest plot service providers make their mark. In contrast to researchers who must juggle tasks such as statistical calculations, meta-analysis and creation of plots, a competent partner in the field of statistical analysis service can generate accurate graphs much faster – sometimes up to 60% faster than in the traditional approach. It is no hype – its real time savings achieved by the division of labor between professional statistics and scientific interpretation by your team.
What does a reliable process include? It includes a combination of several key elements:
- Sophisticated research data analysis and proper use of pooled statistics
- Heterogeneity statistics calculation (I² and other), which is vital for the plot analysis [4]
- Plot validation and forest plot audit to ensure quality prior to submission
- Journal compliance ready formatting for editors and reviewers
- Scientifically transparent visualization of research results
A Real-World Example
Take a middle-sized biotech company that is conducting a meta-analysis for their new anti-inflammatory drug in eight Phase II clinical trials performed in various countries. Each of these trials had different outcomes – sometimes positive, sometimes negative, and one was even opposite.
Without meta-analysis, this information would seem like a messy and contradictory set of data. After synthesizing the results in one forest plot:
- Each trial was represented by a square proportional to its sample size, which immediately gave a hint that the two largest trials with the most patients in favor of the drug
- Confidence intervals revealed that three small trials had crossed the line of no effect, which explains why there was an impression of “mixed” results
- The diamond located to the right of the center line was evident proof of statistical significance of the overall benefit from the use of the drug
- I² value equal to 38% showed that the differences between studies were moderate and not too high [3]
Inconclusive information from eight studies turned into clear and well-defendable claim about efficacy with just one graph. Exactly what a regulatory reviewer or journal editor wants from their submission.
What to Look for in a Forest Plot Partner
When evaluating a research visualization or statistical consulting partner, the difference between a generic freelancer and a genuine specialist shows up in the details:
- Experience gained through the production of forest plots in bio stat forest plots, epidemiology forest plots, and clinical plots
- Quality assurance process in which every effect size and confidence interval is reviewed prior to delivery
- Knowledge of systematic review and meta-analysis software used for regulatory-related research
- The ability to perform forest plot validation and forest plot audits, and not just the product
- Collaborative approach to producing research plots in which you are kept up to date on our work
- Experience dealing with healthcare organizations which are well aware of forest plot compliance requirements
Key Takeaways
Forest plots simplify complex meta-analysis results into clear, evidence-based visualizations for research and regulatory decision-making. Professional forest plot services improve accuracy, ensure publication compliance, and accelerate systematic review workflows. Statswork delivers validated, high-quality forest plots that enhance the credibility and impact of clinical and healthcare research.
Conclusion
With an increase in the pace of conducting clinical trials and publishing evidence-based papers on a quarterly basis, what determines success in such organizations isn’t data but the ability to synthesize it [5]. Your well-crafted forest plot does not just represent your research; it represents the legitimacy of your research before all who see it.
When you find your scientists working on formatting plots rather than on its interpretation, then you need to consider whether this is indeed a good utilization of your scientific minds. You need a forest plot service that will allow your researchers to think only about the results of their study.
Statswork offers quality services in meta-analysis and systematic review support through its Forest Plot Service. Certified statisticians, strict quality assurance procedures and reporting assistance services offered by Statswork allow us to work with leading pharmaceuticals, biotechnology companies and healthcare organizations across the globe.
Contact Statswork’s Forest Plot Service and let us help you make your meta-analysis results speak for themselves.
Frequently Asked Questions (FAQs)
Forest plots are used in systematic reviews to visually summarize and compare the results of multiple studies, helping researchers assess the overall effect size, consistency, and strength of the available evidence.
Forest plots display the combined effect estimates and confidence intervals of individual studies, while funnel plots are used to detect publication bias and assess the symmetry of study results in a meta-analysis.
A forest plot is interpreted by examining the effect sizes, confidence intervals, study weights, and the pooled estimate, along with the line of no effect to determine whether the overall findings are statistically significant.
In a Cochrane meta-analysis, a forest plot provides a standardized visual representation of individual study outcomes and the overall pooled effect, supporting evidence-based healthcare decisions.
The different types of forest plots include those for odds ratios, risk ratios, hazard ratios, mean differences, standardized mean differences, and subgroup analyses, depending on the type of data and outcome being analyzed.
The purpose of a forest plot is to present the results of multiple studies in a single visual summary, allowing researchers to evaluate effect sizes, confidence intervals, heterogeneity, and the overall strength of evidence.
References:
- Akobeng, A. K. (2005). Understanding systematic reviews and meta-analysis. Archives of disease in childhood, 90(8), 845-848. https://adc.bmj.com/content/90/8
- Brush, P. L., Sherman, M., & Lambrechts, M. J. (2024). Interpreting meta-analyses: a guide to funnel and forest plots. Clinical spine surgery, 37(1), 40-42. https://www.ovid.com/jnls/jspinaldis
- Bax, L., Ikeda, N., Fukui, N., Yaju, Y., Tsuruta, H., & Moons, K. G. (2009). More than numbers: the power of graphs in meta-analysis. American journal of epidemiology, 169(2), 249-255. https://academic.oup.com/aje/article
- Li, G., Zeng, J., Tian, J., Levine, M. A., & Thabane, L. (2020). Multiple uses of forest plots in presenting analysis results in health research: a tutorial. Journal of clinical epidemiology, 117, 89-98. https://www.sciencedirect.com/
- Sarkar, S., & Baidya, D. K. (2025). Meta-analysis-interpretation of forest plots: A wood for the trees. Indian Journal of Anaesthesia, 69(1), 147-152. https://www.ovid.com/jnls/ijaweb/