Significance of Big data analytics in the healthcare industry
August 9, 2021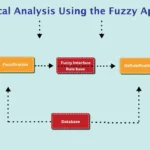
Statistical analysis using the Fuzzy approach
August 11, 2021Standard Statistical Tools in Research and Data Analysis
Introduction
Statistics is a field of science concerned with gathering, organising, analysing, and extrapolating data from samples to the entire population. This necessitates a well-designed study, a well-chosen study sample, and a proper statistical test selection. A good understanding of statistics is required to design epidemiological research, clinical trials , and quantitative research studies. Improper statistical approaches might lead to erroneous findings and unethical behaviour.
Variables in Research
A variable is a trait that differs from one person to the next within a population. Quantitative variables are measured by a scale and provide numerical information, such as height and weight. Qualitative variables, such as sex and eye colour, provide categorical information (Figure 1).

Figure 1. Classification of variables [1]
Quantitative variables
Discrete and continuous measures are used to split quantitative or numerical data. Continuous data can take on any value, whereas discrete numerical data is stored as a whole number such as 0, 1, 2, 3, (integer). Discrete data is made up of countable observations, while continuous data is made up of measurable observations.
- Discrete data examples include the number of respiratory arrest episodes or re-intubation in an intensive care unit.
- Continuous data examples include serial serum glucose levels, partial pressure of oxygen in arterial blood, and oesophageal temperature.
A hierarchical scale with increasing precision can be used based on category, ordinal, interval, and ratio scales (Figure 1).
Statistics in Research
Descriptive Statistics
Descriptive statistics try to explain how variables in a sample or population are related. The mean, median, and mode forms descriptive statistics that give an overview of data. Central tendency describes how observations cluster about a centre point, whereas degree of dispersion describes the spread towards the extremes.
Inferential Statistics
In inferential statistics, data from a sample is analysed to conclude about the entire population. The goal is to prove or disprove hypotheses. Hypothesis testing is an essential process for making logical decisions regarding observed effects’ veracity.

Statistical Software for Data Analysis, Sample Size Calculation, and Power Analysis
There are several statistical software packages accessible today. The most commonly used systems include:
- SPSS – Statistical Package for the Social Sciences (IBM Corporation)
- SAS – Statistical Analysis System (SAS Institute, North Carolina)
- Minitab – Developed by Minitab Inc., USA
- R – Designed by Ross Ihaka and Robert Gentleman (R Core Team)
- Stata – Developed by StataCorp
- MS Excel – Widely used for basic statistical analysis
Several websites and software tools are available for statistical power studies:
- StatPages.net – Links to various online power calculators
- G-Power – Downloadable power analysis software for DOS
- ANOVA power analysis – Interactive webpage for factorial ANOVA design power/sample size estimation
- Sample Power (SPSS) – Generates a comprehensive report that can be exported for research publications
Summary
A researcher must be familiar with the most important statistical methods in research to implement a well-designed study that yields accurate and valid data. Incorrect statistical approaches can result in erroneous findings, mistakes, and reduced significance of published research. Poor statistics can lead to poor research, which may raise ethical concerns.
A proper statistical understanding and correct application of descriptive and inferential statistics are essential. A thorough understanding of fundamental statistical methods will enhance study designs and create high-quality medical research that can be used to develop evidence-based guidelines.