
What Is Content Analysis? Types, Methods & Research Uses
October 14, 2019Application of Logistic Regression using R Programming
October 23, 2019Statistical Data Analysis – Methods, Tools & Techniques | StatsWork
- Home
- Blog
- Statistical Data Analysis – Methods, Tools & Techniques | StatsWork
Meta Analysis Service
Recommended Reads
Contact us
Statistical Data Analysis – Methods, Tools & Techniques | StatsWork
In Brief
- You will find the best Research Areas / Topics for future researchers enrolled in Statswork . These topics are researched in-depth at the University of Columbia, brandies, Coventry, Idaho, and many more and many more.
- In order to identify the future research topics, we have reviewed the stats work on the data analysis.
- The present article was developed based on back ground data conducted on recent peer-reviewed articles addressing data analysis stats work.
- Statistical data analysis is a process of performing numerous statistical functions involving collection of data, interpretation of data and lastly, validation of the data.
- Statistics stated that the descriptive or summary statistics are used to summarize/describe the sample data and the inferential statistics are used to infer conclusions from the hypotheses framed.
- Download our StatsWork References such as tutorials, proprietary materials, research projects and many more @ https://www.statswork.com/directory/
“Statistics is the only science where the experts may come up with different conclusion with the same data”
What is Statistical data analysis?
Statistics are the branch of mathematics used to analyse the data that can describe, summarize and compare. Statistical Data Analysis is a process of performing numerous statistical functions involving collection of data, interpretation of data and lastly, validation of the data. Numerous statistical tools such as SAS, SPSS, STATA, etc., are available nowadays to analyse the statistical data from simple to complex problems based on the nature of the study.
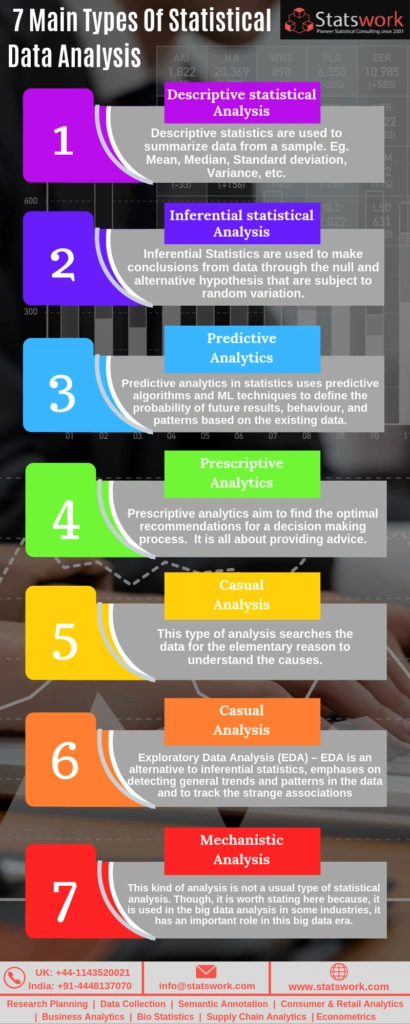
Types of statistical data analysis
In the field of statistics, there are two widely used statistical methods in data analysis. They are:
- Summary or Descriptive statistics
- Inferential statistics
- Descriptive
statistics are used to summarize data from a sample. Eg. Mean, Median, Standard deviation,
Variance, etc.
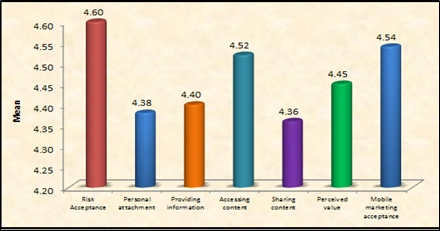
Below table reveals the descriptive statistics of the study variables
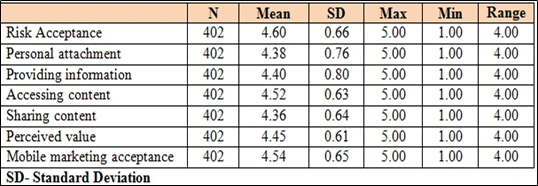
- Inferential statistics are used to make conclusions from data through the null and alternative hypotheses that are subject to random variation. Simply, it can be stated that the descriptive or summary statistics are used to summarize/describe the sample data and the inferential statistics are used to infer conclusions from the hypotheses framed.
Uses of Statistics
- Provides a better understanding of the data and precise description of a state of art under study.
- Assist in the appropriate and effective planning of Statistical Analysis in any field of study.
- Assist in presenting complex data in an appropriate tabular and graphical format for easy and clear knowledge of the sampled data.
- Assist in understanding the pattern and trends of variations in the sampled data.
- Helps to make valid inferences, by measuring the reliability parameters for the sampled data towards the population.
Furthermore, the following areas are the one in which statistics plays a major role:
- Statistical analysis in market
research - BI – Business
intelligence - Data analytics in Big
data, Machine Learning and Deep learning, etc - Financial and
economic studies.
What is a Data mean in statistics?
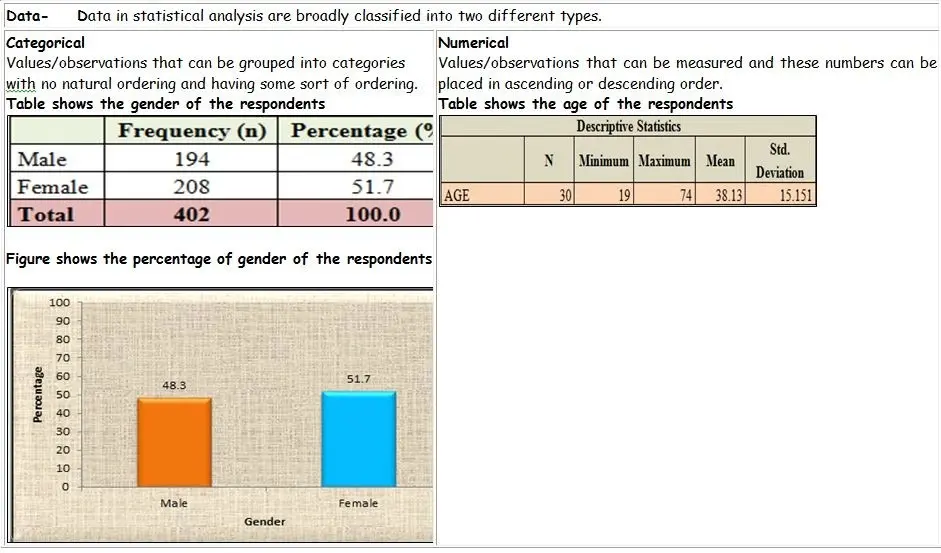
The nature of the data plays a vital role in the field of statistics. It is atmost important to identify the nature of the data before planning the research analysis. Usually, in statistics, there are various kinds of data available for the study, they are: Discrete data and continuous data are grouped as numerical, Categorical data involving nominal and ordinal. Mostly, every sampled data belong to any one of two groups: categorical or numerical and are described in the following table for easy understanding.
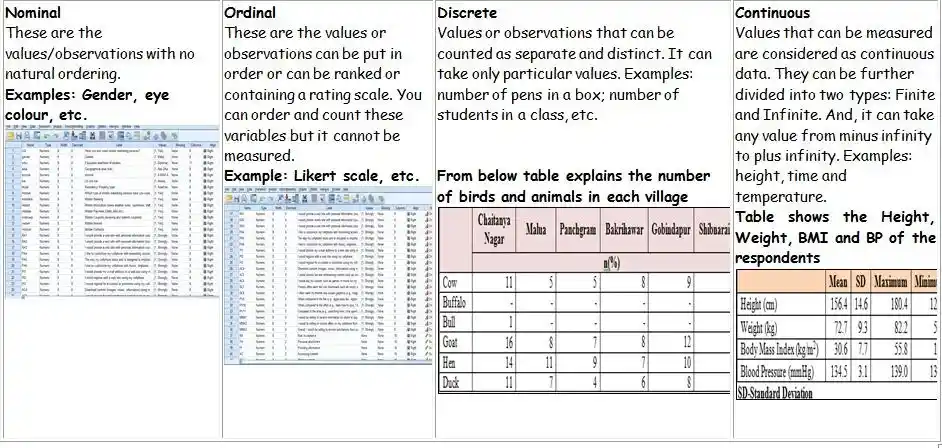
PMF and PDF
Every statistical data follows certain distribution function in the theory. In the statistical data analysis, continuous data are scattered under continuous distribution function, also called as the pdf or probability density function, whereas, the discrete data are scattered under discrete distribution function, also called as the pmf or probability mass function. Generally, the phrase ‘density’ is used for data in continuous form because density cannot be counted, but can be measured. Normal distribution, Poisson distribution, Binomial distribution, etc., are the most commonly used distribution in the statistical analysis.
In practice, statistical data analysis are broadly classified into two types: Univariate and Multivariate. If we wish to analyse the data which contains only one variable, then the univariate statistical analyses such as t-test, z test, f test, one way ANOVA, etc., can be performed. If the data contains two or more variables, then the multivariate techniques such as factor analysis, regression analysis, discriminant analysis, etc., can be performed depends on the nature of the study.
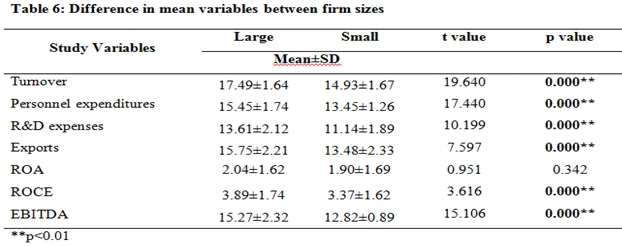
T-test
The t-test analysis is a statistical model which compares the values in two different groups to determine when there is enough difference between the data.
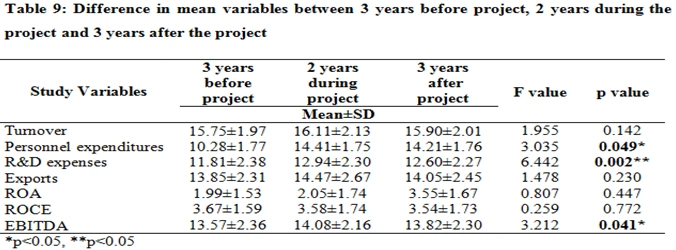
Analysis of Variance
Analysis of Variance (ANOVA) is a method utilized to decide whether the mean values of dependent variables remain constant when implemented in different groups which are independent of each other.
Apart from the above mentioned kinds of statistical analysis, there are also other important analyses every data scientist should know. They are:
- Predictive Analytics – Predictive analytics in statistics uses predictive algorithms and ML techniques to define the probability of future results, behavior, and patterns based on the existing data.
- Causal Analysis – This type of analysis searches the data for the elementary reason to understand the causes.
- Exploratory Data Analysis (EDA) EDA is an alternative to inferential statistics, emphases on detecting general trends and patterns in the data and to track thestrange associations. It is widely used by the data scientist to check the assumptions of the hypotheses, to detect outliers, to handle missing data, etc.
- Mechanistic Analysis – This kind of analysis is not the usual type of statistical analysis. Though it is worth stating here because it is used in the big data analysis in some industries, it has an important role in this big data era.
To sum up, Statistical data analysis can be simplified into five steps, as follows:
- The primary step involves the identification of the nature of the data to be analyzed.
- Secondly, explore the association between the data and the underlying population in the study.
- Build a suitable model to summarize the data and proceed for further analysis.
- Check the validity of the model and take decisions about the hypotheses.
- Explore predictive analysis to run situations that will guide us for future actions.
References
- V.K.Rohatgi (1976). “An Introduction to Probability and Statistics”, John Wiley & Sons.
- Casella G. and Berger R L. (2002) “Statistical Inference”, Second Edition, Duxbury Advanced Series.
- Alan Agresti (1992), “An Introduction to categorical data analysis”, Second Edition, John Wiley & Sons.
- Mood, A. M. (1950). Introduction to the theory of statistics. New York, NY, US: McGraw-Hill.