What is Interpretation of Research Data
- Home
- Insights
- Article
- What is Interpretation of Research Data
Qualitative Research Service
News & Trends
Recommended Reads

Data Collection
As the data collection methods have extreme influence over the validity of the research outcomes, it is considered as the crucial aspect of the studies
- 1. Introduction
- 2. DeepHealth’s Diagnostic Suite™: Revolutionizing Radiology Workflows
- 3. Key Features
- 4. AI Impact on National Screening Programs
- 5. SmartMammo™: Enhancing Breast Cancer Screening
- 6. DeepHealth AI Use Cases Across Specialties
- 7. Strategic Collaborations and Ecosystem Expansion
- 8. Impact and Adoption of DeepHealth’s AI Solutions
- 9. Conclusion: The Future of Radiology with AI
- 10. References
Introduction
Data interpretation in a research setting means looking at, analysing, and interpreting collected data to draw useful insights from it. This is a very important step in any research activity since it creates the link between the collected information and useful findings from such information. As researchers collect lots of data, it becomes very important to be able to interpret the data to make any meaningful use of it. [1]
Purpose of Interpreting Research Data
Interpretation of research data is key to analysing information obtained from research, thereby allowing one to derive useful conclusions and take proper decisions based on the same.
- Transforming Data into Information: Interpretation aids in transforming raw data and information into insights.
- Verifying the Results of the Study: The process helps researchers verify whether their hypotheses were right or wrong.
- Finding the Answers to Research Questions: The interpretation of data plays a role in answering the research questions.
- Being Consistent with the Aim of the Study: It makes sure that the findings are consistent with the aim of the research.
- Helping in Making Informed Decisions: Interpretation is useful for making decisions based on data. [2]
Methods Used in Data Interpretation
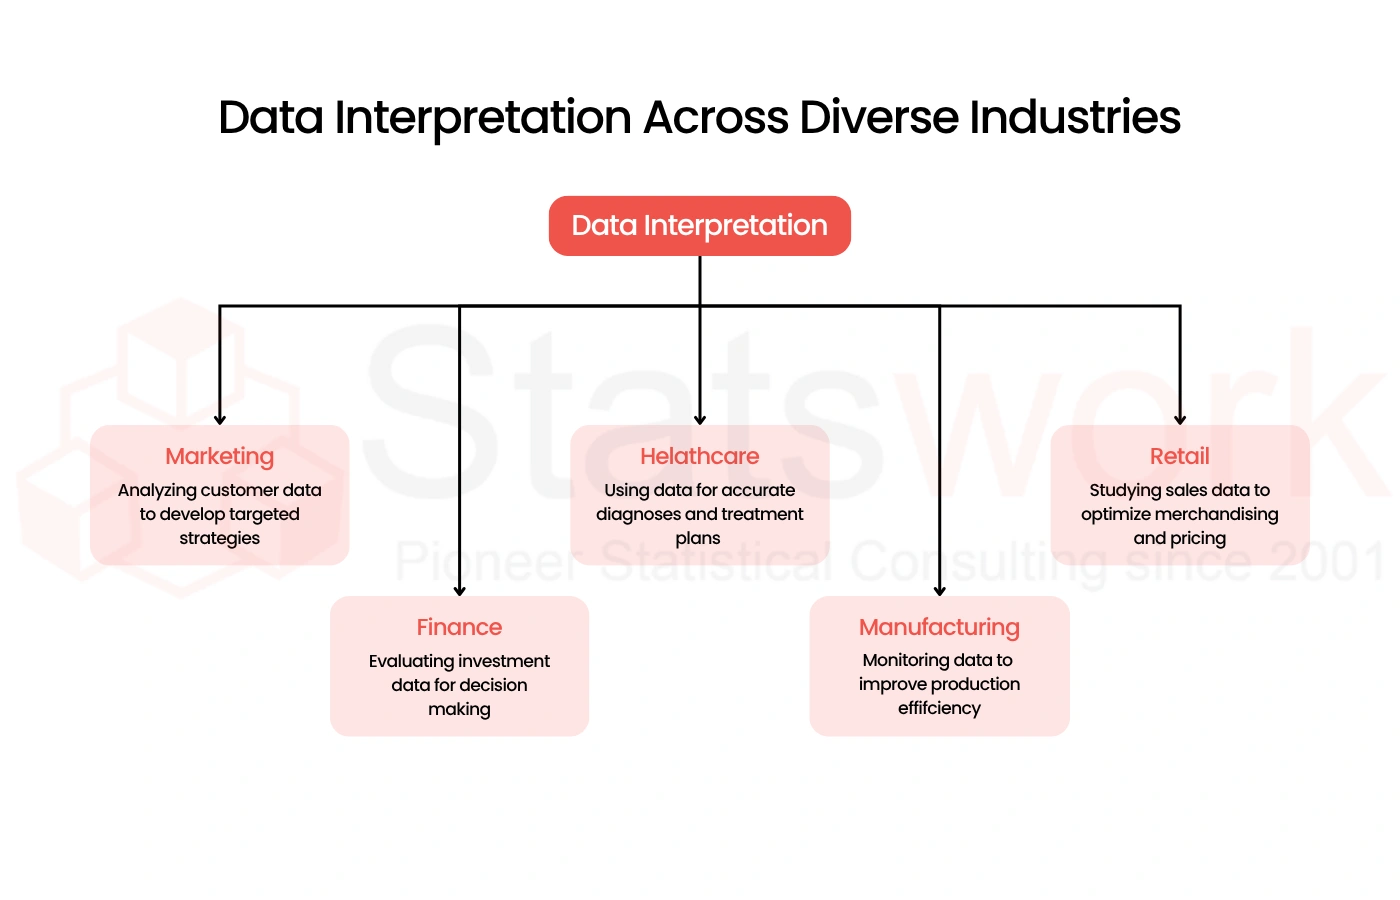
The various types of data interpretation methods depend on the nature of the data collected. Data interpretation aids in effective analysis and interpretation of data into valuable information.
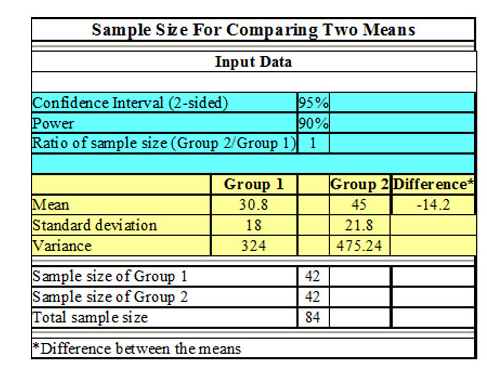
- Quantitative Data Interpretation: Numbers in data are interpreted using methods such as mean, percentages, and correlation analysis.
- Qualitative Data Interpretation: Data that is non-numerical in form is interpreted using techniques such as thematic analysis and pattern recognition.
- Techniques for Interpreting Data: A wide range of techniques is utilized for the purpose of examining and drawing conclusions about the data.
- Simplification of Data: Data interpretation techniques facilitate simplification of complicated data.
- Methods for Data Visualization: Charts, tables, and graphs are some of the visual aids used for presenting data. [3]
Techniques Used in Data Interpretation
There exist several methods of analysing data in order to draw meaningful conclusions and insights out of them. Each of these methods has particular functions to perform according to its applicability in relation to certain types of data.
| Technique | Explanation | Example Use Case |
| Descriptive Analysis | Summarizes data using measures like mean and median | Analysing survey responses |
| Comparative Analysis | Compares two or more datasets | Before-and-after performance evaluation |
| Trend Analysis | Identifies patterns over time | Tracking annual sales growth |
| Correlation Analysis | Measures relationships between variables | Linking customer feedback to retention |
| Regression Analysis | Predicts outcomes based on variable relationships | Forecasting market demand |
These methods are integral parts of statistical data interpretation that make use of the available data. [4]
Importance of Accurate Data Interpretation
Understanding research data analysis correctly is very crucial because it will help you in making reliable, valid, and meaningful interpretations that will assist in making sound decisions.
- Validity and Reliability in Research: Correct interpretation guarantees that scientific data is reliable and valid.
- Potential Problems Caused by Wrong Interpretations: Misinterpreted scientific information may lead to false conclusions and wrong approaches.
- Using Correct Interpretation Techniques: The use of appropriate techniques will ensure accuracy of scientific information.
- Data-driven Decisions making in Business: Properly interpreted data allows organizations to make accurate decisions.
- Improving Scientific Research: Interpretation makes scientific information more credible and reliable. [5]
Conclusion
In summary, data interpretation is a crucial aspect of research which ensures that the collected data is transformed into useful findings. It includes the processes of examining and interpreting the collected data in order to develop conclusions that are consistent with the research goals. Proper methods can be used by the researcher in order to achieve accurate data interpretation and results. In addition, incorporating quantitative and qualitative analysis ensures better data interpretation.
Unlock powerful insights with Statswork’ssecondary quantitative data collection service, driven by expert interpretation of research data.
References
- Alem, D. D. (2020). An overview of data analysis and interpretations in research. International Journal of Academic Research in Education and Review, 8(1), 1-27. https://www.academia.edu/
- Pöchhacker, F. (2011). Researching interpreting. Advances in interpreting research: Inquiry in action, 99, 5-25. https://www.torrossa.com/gs/
- Kokot, S., Grigg, M., Panayiotou, H., & Phuong, T. D. (1998). Data interpretation by some common chemometrics methods. Electroanalysis: An International Journal Devoted to Fundamental and Practical Aspects of Electroanalysis, 10(16), 1081-1088. https://analyticalsciencejournal
- Ogiela, L., & Ogiela, M. R. (2009). Cognitive techniques in visual data interpretation(Vol. 228, pp. 29-39). Heidelberg: Springer. https://link.springer.com/
- Lewis, R. S., Graham, D. G., Watson, J. D., & Lunniss, P. J. (2012). Learning the hard way: the importance of accurate data. Colorectal Disease, 14(8), 1015-1018. https://onlinelibrary.wiley.com/