statswork

Stronger Analysis. Smarter Research. Bigger Savings!
Access expert statistical analysis and research support at Flat 24% Off
Stronger Analysis. Smarter Research. Bigger Savings!
Access expert statistical analysis and research support at Flat 24% Off.

How to Model Surgeon Learning Curves in Medical Device Meta-Analysis for Swiss HTA?

Summary

Surgeon experience can influence operating time, complications, conversion rates and resource use during medical device adoption. A meta-analysis that combines early adoption cases with established practice without accounting for learning may produce estimates that are poorly suited to clinical and economic decision-making.

For Swiss health technology assessment (HTA), learning-related uncertainty can affect assessments of healthcare services and procedures involving medical technologies. Appropriate analysis requires systematic extraction of experience-related outcomes, selection of defensible statistical models, validation of learning-curve estimates and transparent economic evaluation.

Why Surgeon Learning Curves Matter in Swiss HTA

Article 32 of Switzerland’s Federal Health Insurance Act (KVG/LAMal) establishes effectiveness, appropriateness and economic efficiency as criteria for reimbursed benefits. The Federal Office of Public Health (FOPH/BAG) HTA programme evaluates healthcare services and interventions; it should not be interpreted as a universal device-specific assessment pathway. [1,2]

Early procedures may take longer and involve more technical difficulties than procedures performed after experience accumulates. However, learning varies by surgeon, procedure, device, outcome and clinical setting.

Ignoring experience may produce pooled estimates that represent neither initial adoption nor established practice. Expert-centre studies may overstate performance achievable during wider implementation, while studies dominated by early cases may overstate risks during mature use.

The appropriate analysis depends on the decision question, comparator and intended implementation setting. The objective is to estimate clinically relevant performance while distinguishing learning-related variation from patient characteristics, centre expertise and other sources of heterogeneity.

Extract Learning-Curve Evidence Systematically

The review protocol should prespecify how surgeon experience and chronological outcomes will be identified. PRISMA 2020 supports transparent reporting of systematic reviews but does not prescribe a specific learning-curve model. [3]

Searches should combine device and procedure terms with phrases such as learning curve, cumulative case volume, surgeon experience, operator proficiency and training.

Extract, where available:

  • Cumulative procedures performed by each surgeon.
  • Chronological outcomes, including operating time, complications and conversion rates.
  • Surgeon and centre identifiers, patient characteristics and procedure complexity.
  • Training, proctoring, device generation and follow-up duration.
  • Proficiency definitions and methods used to identify learning-curve plateaus.
  • Missing experience data and outcome-reporting methods.

Experience phases from the same surgeon or centre are not necessarily independent. Treating repeated phases as independent observations can underestimate uncertainty. The IDEAL framework can inform systematic evaluation and reporting of surgical innovation, although it does not prescribe one universal statistical model. [7]

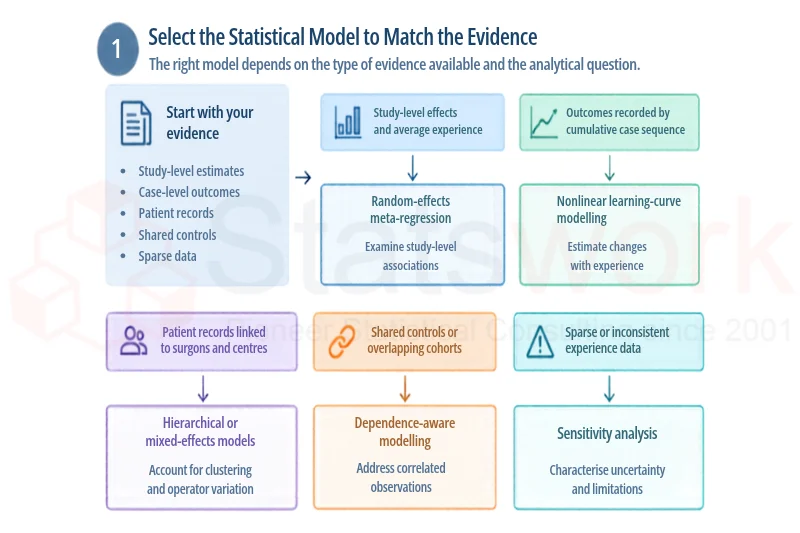
Select the Statistical Model to Match the Evidence

Evidence available

Analytical approach

Primary purpose

Study-level effects and average experience

Random-effects meta-regression

Examine study-level associations

Outcomes recorded by cumulative case sequence

Nonlinear learning-curve modelling

Estimate changes with experience

Patient records linked to surgeons and centres

Hierarchical or mixed-effects models

Account for clustering and operator variation

Shared controls or overlapping cohorts

Dependence-aware modelling

Address correlated observations

Sparse or inconsistent experience data

Sensitivity analysis

Characterise uncertainty and limitations

learning curve modelling


Random-effects meta-regression

When studies report comparable effect estimates and experience measures, random-effects meta-regression can investigate whether study-level experience is associated with treatment effects.

A standard model is:

y_i=θ_i+ε_i
θ_i=β_0+β_1 X_i+u_i

Here,  is the observed effect estimate,  is the underlying study effect,  is a prespecified study-level experience measure, and  represents its association with the underlying effect. The residual between-study variation is represented by , conventionally modelled with variance , while  represents sampling error.

The model assumes an appropriate sampling-error structure. Multiple estimates from shared controls or overlapping cohorts may require covariance modelling.

Importantly,  does not estimate the causal effect of an individual surgeon gaining experience. Study-level associations may be confounded by patient selection, training, centre expertise and device generation. Meta-regression also requires sufficient studies and meaningful variation in experience. The commonly cited heuristic of approximately ten studies per covariate is not a universal minimum or guarantee of adequate power. [5,6]

Nonlinear learning-curve modelling

When outcomes are recorded by cumulative procedure sequence, an exponential model may be considered:

Here,  is the expected outcome after  procedures,  is the initial expected outcome,  is the asymptotic plateau, and  determines the rate of change.

This is an illustrative model, not a universal form. Restricted cubic splines or piecewise models may better represent gradual, abrupt or non-monotonic changes when sufficient observations are available. Operating time and complication risk may also follow different learning trajectories. [4,8]

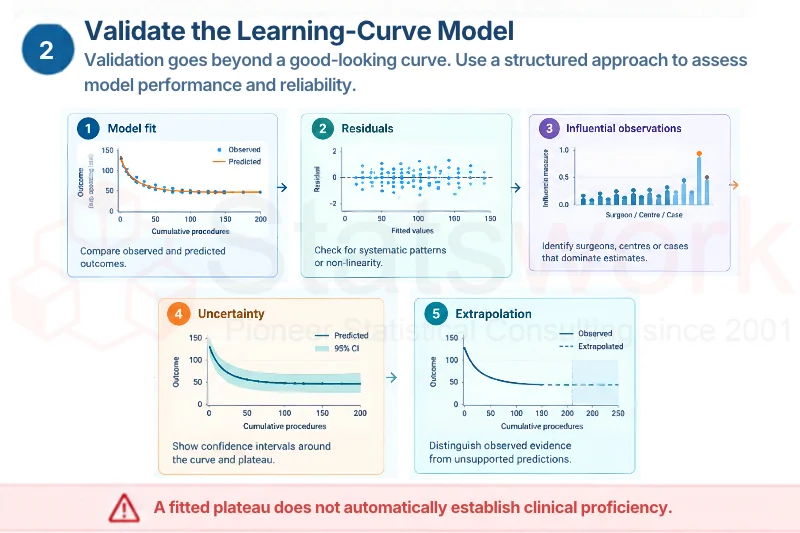
Validate the learning-curve model

Model selection should be followed by explicit validation rather than relying solely on a good-looking fitted curve.

  • Model fit: Comparison of the observed and predicted outcomes within the range of experience using proper measures of goodness-of-fit and comparing possible alternative models.
  • Residuals analysis: Check for any systematic structure in the residuals, changing variance, outliers and trends which cannot be explained by the chosen curve. The patterns in residuals may suggest the inadequacy of the assumed curve in representing the data.
  • Influential observations: Identification of whether the estimates of the curve are driven mainly by a few surgeons, hospitals or early cases. Sensitivity analysis without influential observations could show the instability in the estimates.
  • Uncertainty estimation: Reporting of confidence intervals or other forms of uncertainty intervals of model parameters and predictions. Also, checking the uncertainty of the estimated plateau and number of cases needed to reach a prespecified criterion of proficiency.
  • Extrapolation check: Do not make predictions outside the range of the observed case sequence. If there are only observations of the early cases, then there could be no identification or poor identification of the plateau.
  • Robustness: Compare different specifications and assumptions and reporting of change of the results.
learning curve modelling

Image 2: validating the learning-curve model

A fitted plateau is not automatically evidence of clinical proficiency. The plateau and any proficiency threshold should be clinically meaningful, supported by adequate data and interpreted alongside uncertainty. Internal validation or cross-validation may help assess predictive performance when the dataset is sufficiently large, but neither can compensate for sparse or unrepresentative evidence.

Handle Dependence Between Observations

Surgical studies may include repeated experience phases, several surgeons within one centre, shared control groups or overlapping patient cohorts. Treating correlated observations as independent can underestimate standard errors and produce overly narrow confidence intervals.

Map surgeons, centres, recruitment periods, comparators and cohorts before pooling results. Consider multilevel models for clustered observations, appropriate covariance structures for shared controls, and a defensible non-overlapping dataset when cohort overlap cannot be resolved.

Robust variance estimation may be useful in some settings, but its reliability depends on the assumptions and number of independent clusters. Adding a random-effects term alone does not necessarily resolve every form of dependence.

Illustrative Example: From Learning to Procedure Costs

Consider a hypothetical scenario, not observed Swiss clinical evidence.

OutcomeEarly casesEstablished cases
Mean operating time150 minutes100 minutes
Complication rate12%6%
Conversion rate8%4%


Suppose 100 procedures comprise 40 early cases and 60 established cases. The weighted mean operating time is:

T ̅=(40(150)+60(100))/100=120″ minutes”

Expected complications equal , while expected conversions equal . These are expected values, not fractional actual patients.

Assume illustrative costs of CHF 30 per operating-room minute, CHF 4,000 per complication and CHF 2,500 per conversion. Under additive-cost assumptions with no overlap between event costs, the results are:

Cost componentMixed adoptionEstablished performance for all cases
Operating-room timeCHF 360,000CHF 300,000
ComplicationsCHF 33,600CHF 24,000
ConversionsCHF 14,000CHF 10,000
Total per 100 proceduresCHF 407,600CHF 334,000

The difference is CHF 73,600 per 100 procedures under these assumptions. This is an illustrative cost comparison, not an empirical Swiss estimate or proof of causality. Actual analyses should account for uncertainty, clustering, overlapping events and possible double counting.

Distinguish Budget Impact from Cost-Effectiveness

The example above estimates costs under alternative adoption scenarios. It resembles a simplified budget-impact calculation because it focuses on the financial consequences of different patterns of implementation. A budget-impact analysis typically estimates the expected financial consequences for a defined payer or healthcare budget over a specified period, accounting for eligible population size, uptake and relevant costs.

A cost-effectiveness analysis asks a different question: how do costs and health outcomes compare between an intervention and its comparator?

Incremental costs are calculated as:

ΔC=C_”device” -C_”comparator”

Incremental health outcomes are:

ΔE=E_”device” -E_”comparator”

When appropriate, the incremental cost-effectiveness ratio (ICER) is:

ICER=ΔC/ΔE

The health outcome might be quality-adjusted life-years (QALYs), complications avoided or another prespecified outcome. The choice should match the decision context and relevant evaluation requirements. An ICER must be interpreted alongside uncertainty and the direction of incremental costs and effects; it is not meaningful in every decision scenario.

For Swiss HTA, learning-adjusted estimates may inform operating costs, complications, training requirements and health outcomes in an economic model. Probabilistic sensitivity analysis, alternative adoption scenarios and structural sensitivity analyses can test how uncertainty in the learning curve affects conclusions.

Use appropriate Swiss-specific costs and the relevant analytical perspective. Avoid double-counting costs when operating time, complications and conversions overlap. If the learning curve is weakly identified, test plausible alternatives rather than presenting an uncertain plateau as established fact.

How Statswork Can Support the Analysis

Statswork’s Meta-Analysis services help you combine surgical evidence, model learning curves, identify sources of heterogeneity and quantify uncertainty in clinical outcomes and adoption costs. Preparing a medical-device evaluation for Swiss HTA? Contact Statswork today to discuss your dataset and receive tailored statistical support for a robust, reproducible analysis that strengthens your evidence-based decisions.

Conclusion

Surgeon learning curves should be considered during review design, statistical modelling and economic evaluation. Meta-regression examines study-level associations, while direct learning-curve models estimate changes with cumulative experience. IPD and hierarchical models can provide additional insight when suitable data are available.

Model validation should assess fit, residual patterns, influential observations, parameter uncertainty and the credibility of estimated plateaus. Economic evaluations should distinguish budget impact from cost-effectiveness and carry relevant clinical uncertainty into estimates of incremental costs and health outcomes.

Frequently Asked Questions

Experience may influence operating time, complications and conversions, affecting pooled clinical estimates and resource-use assumptions.

Not automatically. Learning must be explicitly investigated through an appropriate model or analysis.

Assess model fit, residual patterns, influential observations, parameter uncertainty, plateau identifiability and robustness to alternative specifications.

No. It estimates study-level associations that may be confounded by other study characteristics.

Budget impact estimates financial consequences for a defined budget and period. Cost-effectiveness compares incremental costs with incremental health outcomes, potentially using an ICER.

References:

  1. Swiss Confederation. Federal Act on Health Insurance (KVG/LAMal), Article 32. Fedlex. https://www.fedlex.admin.ch/eli/cc/1995/1328_1328_1328/en#art_32
  2. Federal Office of Public Health. Health Technology Assessment (HTA) Programme. https://www.bag.admin.ch/en/health-technology-assessment-hta-3  
  3. Page MJ, McKenzie JE, Bossuyt PM, et al. The PRISMA 2020 statement: an updated guideline for reporting systematic reviews. BMJ. 2021;372:n71. https://doi.org/10.1136/bmj.n71
  4. Ramsay CR, Grant AM, Wallace SA, Garthwaite PH, Monk AF, Russell IT. Assessment of the learning curve in health technologies: a systematic review. International Journal of Technology Assessment in Health Care. 2000;16(4):1095–1108. https://doi.org/10.1017/s0266462300103149  
  5. Thompson SG, Higgins JPT. How should meta-regression analyses be undertaken and interpreted? Statistics in Medicine. 2002;21(11):1559–1573. https://doi.org/10.1002/sim.1187
  6. Deeks JJ, Higgins JPT, Altman DG, McKenzie JE, Veroniki AA, editors. Cochrane Handbook for Systematic Reviews of Interventions: Chapter 10—Analysing Data and Undertaking Meta-Analyses. Cochrane; 2024. https://www.cochrane.org/authors/handbooks-and-manuals/handbook/current/chapter-10
  7. McCulloch P, Altman DG, Campbell WB, et al. No surgical innovation without evaluation: the IDEAL recommendations. The Lancet. 2009;374(9695):1105–1112. https://doi.org/10.1016/S0140-6736(09)61116-8
  8. Ramsay CR, Wallace SA, Garthwaite PH, Monk AF, Russell IT, Grant AM. Assessing the learning curve effect in health technologies: lessons from the nonclinical literature. International Journal of Technology Assessment in Health Care. 2002;18(1):1–10. https://pubmed.ncbi.nlm.nih.gov/11987432/

Contact us