
- Services
- Data Analysis services
- Sample Work
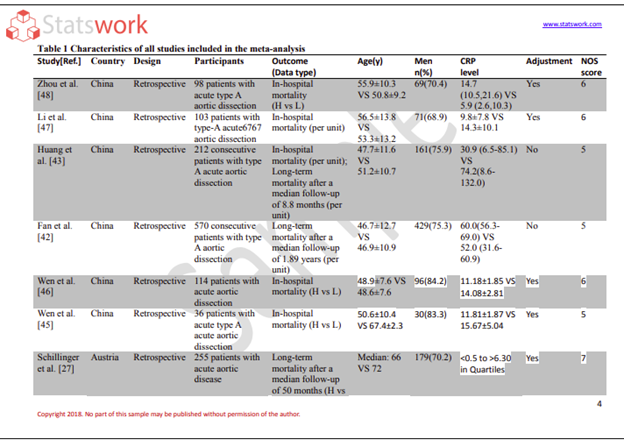
Data Analysis services
- Secondary Qualitative Research Services
- Secondary Quantitative Research Services
- Meta-Analysis Research services
- Sample Work
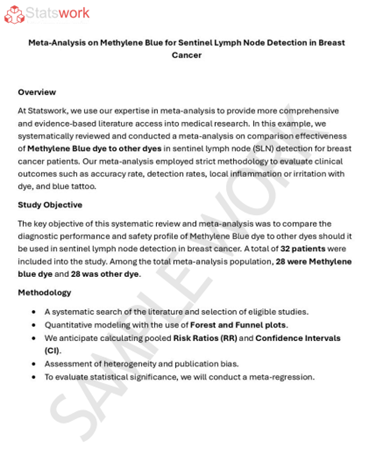
Meta-Analysis Research Services
- Data Collection Services
- Sample Work
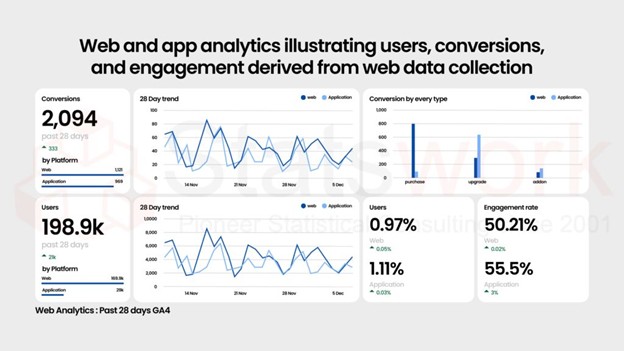
Data Collection Services
- Statistical & Biostatistics services
- Sample Work
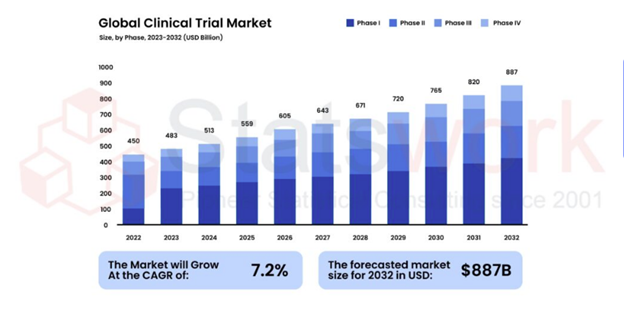
Statistical Programming & Biostatistics services
- Data Management Services
- Sample Work
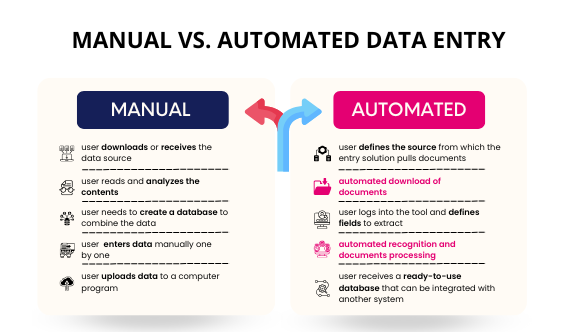
Data Management Services
- Research methodology services
- Sample Work
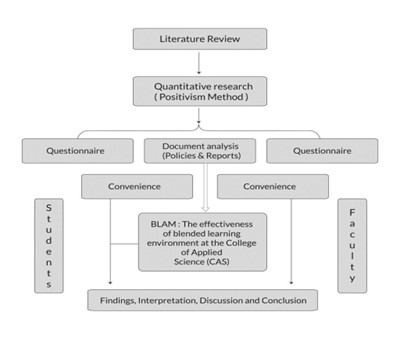
Research methodology services
- Tool Development Services
- Sample Work
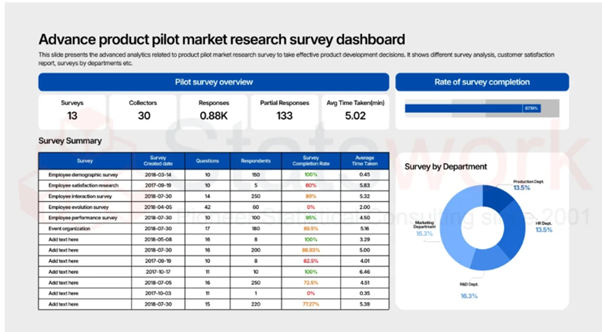
Tool development services
- Statistical Interpretation services
-
Statistical Interpretation services
- Sample Work
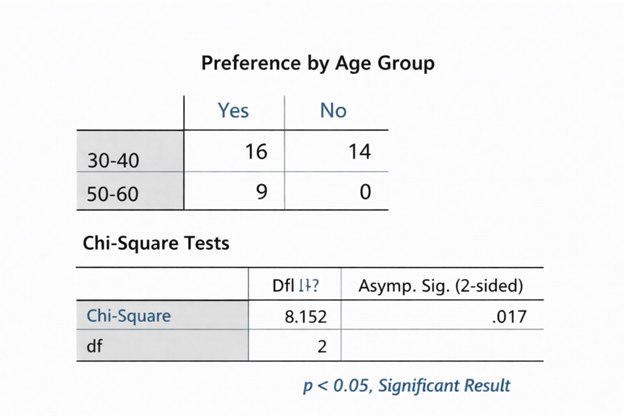
Statistical Interpretation services
-
- Sample Size Calculation Services
-
Sample Size Calculation Services
- Sample Work
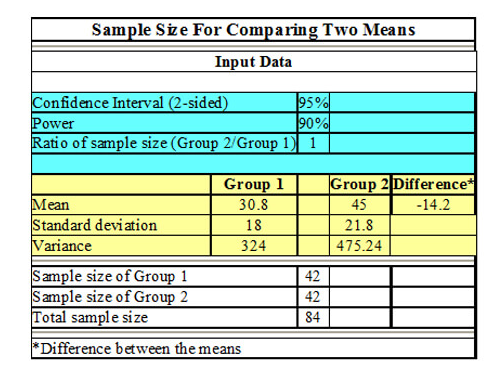
Sample Size Calculation Services
-
- AI & ML Services
-
Artificial Intelligence and Machine Learning Services
- Sample Work
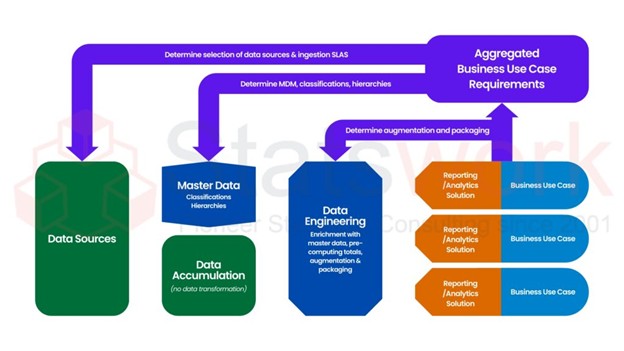
Artificial Intelligence and Machine Learning Services
-
- Meaningful Visualization Services
- Thought Leadership Services
- Report Generation Services
-
Report generation Service
- Sample Work
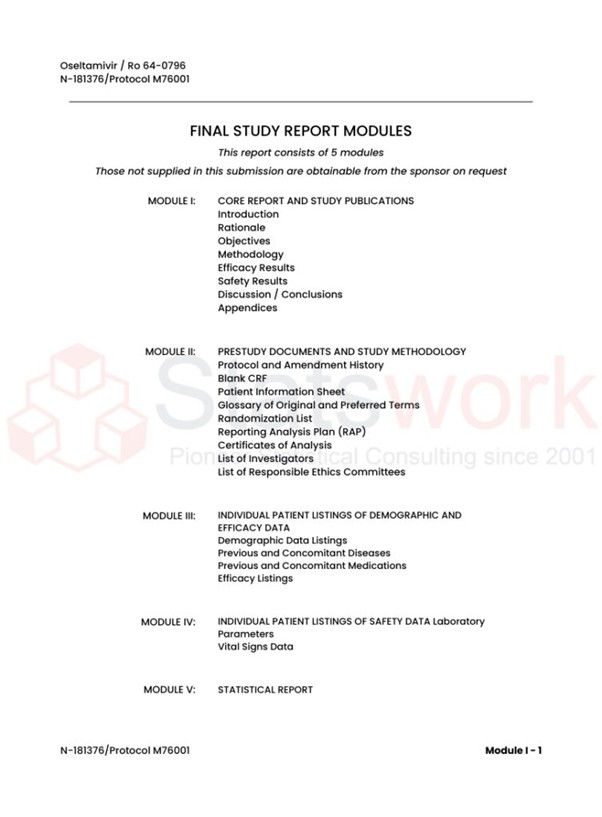
Report generation Services
-
- Data Analysis services
- Industries
- About Us
- Blog
- Insights
- Contact Us
- Services
- Data Analysis services
- Sample Work
Data Analysis services
- Secondary Qualitative Research Services
- Secondary Quantitative Research Services
- Meta-Analysis Research services
- Sample Work
Meta-Analysis Research Services
- Data Collection Services
- Sample Work
Data Collection Services
- Statistical & Biostatistics services
- Sample Work
Statistical Programming & Biostatistics services
- Data Management Services
- Sample Work
Data Management Services
- Research methodology services
- Sample Work
Research methodology services
- Tool Development Services
- Sample Work
Tool development services
- Statistical Interpretation services
-
Statistical Interpretation services
- Sample Work
Statistical Interpretation services
-
- Sample Size Calculation Services
-
Sample Size Calculation Services
- Sample Work
Sample Size Calculation Services
-
- AI & ML Services
-
Artificial Intelligence and Machine Learning Services
- Sample Work
Artificial Intelligence and Machine Learning Services
-
- Meaningful Visualization Services
- Thought Leadership Services
- Report Generation Services
-
Report generation Service
- Sample Work
Report generation Services
-
- Data Analysis services
- Industries
- About Us
- Blog
- Insights
- Contact Us
Facing FDA and HPRA Inspections at the Same Site: Can One Data Integrity Analysis Satisfy Part 11 and the Revised Annex 11?
Data Analysis Services
Recommended Reads
Contact us
Summary
Irish pharmaceutical manufacturers can strengthen FDA and HPRA inspection readiness through one reproducible statistical evidence base. By quantifying data-integrity exceptions, assessing uncertainty, monitoring trends and verifying CAPA effectiveness, sites can distinguish meaningful risks from changes in detection. Shared analysis reduces duplicated effort while preserving separate regulatory assessments and defensible, evidence-based compliance decisions.
One analytical evidence base, two regulatory perspectives
Irish pharmaceutical manufacturers supplying international markets may need to demonstrate trustworthy electronic records to the US Food and Drug Administration (FDA) and the Health Products Regulatory Authority (HPRA). Preparing separate inspection reports can duplicate data extraction, reconciliation, statistical summaries and quality-team effort.
A shared analytical evidence base can reduce duplication while preserving separate regulatory assessments. FDA 21 CFR Part 11 addresses electronic records and electronic signatures within its applicable scope, alongside underlying requirements. EU GMP Annex 11 addresses computerised systems used in pharmaceutical manufacturing. These frameworks are not interchangeable. [1,4] The objective is one reproducible analytical workflow, not one universal compliance conclusion.
Annex 11 is under revision. The European Commission published a draft revised Annex 11 for public consultation in 2025 [2]. At the time of writing the draft has not been adopted, and the January 2011 text remains the version in force [1]. Analyse against the 2011 requirements, and track the draft for changes relevant to audit-trail review, electronic signatures and access control. Confirm the current status of both texts before relying on either.
Build a governed dataset with defined outcomes
Relevant sources include laboratory information management systems (LIMS), manufacturing execution systems (MES), electronic batch records and quality-management systems (QMS). Standardise event definitions, reporting periods, system identifiers, severity categories and duplicate-handling rules before combining data.
Separate four measures:
- Alert volume: Alerts generated or flagged by audit-trail monitoring.
- Confirmed exception rate: Confirmed exceptions divided by eligible events reviewed.
- Critical-event recurrence: Repeat critical events relative to an appropriate exposure or follow-up period.
- Review coverage: Eligible high-risk records reviewed divided by eligible high-risk records requiring review.
These measures answer different questions. An automated alert is not necessarily a confirmed failure, and a record correction does not automatically establish misconduct. Missing metadata also requires interpretation in the context of the record and its intended use.
Document extraction logic, missing data, exclusions and review selection. Link related alerts to underlying incidents so that one failure generating several notifications is not automatically counted as several independent events. Preserve source-record traceability throughout the analysis.
PIC/S guidance supports risk-based data management and integrity assessment in regulated GMP/GDP environments. Statistical indicators complement investigation and quality-system evidence; they do not replace them. [3]
Quantify exception rates and uncertainty
Raw counts describe workload but cannot reliably compare systems with different activity levels or review coverage. Calculate the confirmed exception rate using a consistent eligible population:
Consider an illustrative site reporting 25 exceptions among 5,000 reviewed events, followed by 32 among 8,000.
Measure | Period 1 | Period 2 |
Events reviewed | 5,000 | 8,000 |
Confirmed exceptions | 25 | 32 |
Exception rate | 0.50% | 0.40% |
Approximate 95% Wilson interval | 0.34–0.74% | 0.28–0.57% |
The observed rate decreases by 0.10 percentage points, equivalent to a 20% relative reduction, despite the increased count.
The Wilson intervals quantify uncertainty around each proportion under a simple binomial model. [6] Their overlap does not establish that the rates are equal, and non-overlap is not a substitute for directly estimating the difference or rate ratio. A formal comparison must reflect the study design and dependence structure.
For a rate comparison, calculate:
The observed rate in Period 2 is 80% of the Period 1 rate. Under independent Poisson-count assumptions, an approximate standard error for the log rate ratio is: [7]
The approximate 95% confidence interval is:
Because this interval includes 1.0, the observed reduction does not establish a statistically significant rate change at the conventional two-sided 5% level under this model. The data remain compatible with a reduction, little change or an increase.
This interpretation depends on the assumptions. Exceptions clustered within batches, systems or users may not be independent; a simple Poisson model can then underestimate uncertainty. Overdispersion, inconsistent detection and biased review selection also require attention. Confidence intervals cannot correct unsuitable denominators or biased sampling.
Categorise findings by systems, severity, types of exceptions, and processes. An infrequent exception in a critical manufacturing document may have higher priority than repetitive administrative problems. Prioritisation should consider severity, recurrence and potential product-quality impact, not frequency alone.
Monitor trends without confusing detection changes with deterioration
Any rise in the number of data integrity findings could be due to a true decline in controls, increased audit scope, changes in detection tools, or new detection criteria. Analyse the findings relative to measures of exposure, like documents examined or batches tested, and analyse any change in audit practices before drawing the conclusion that controls have weakened.
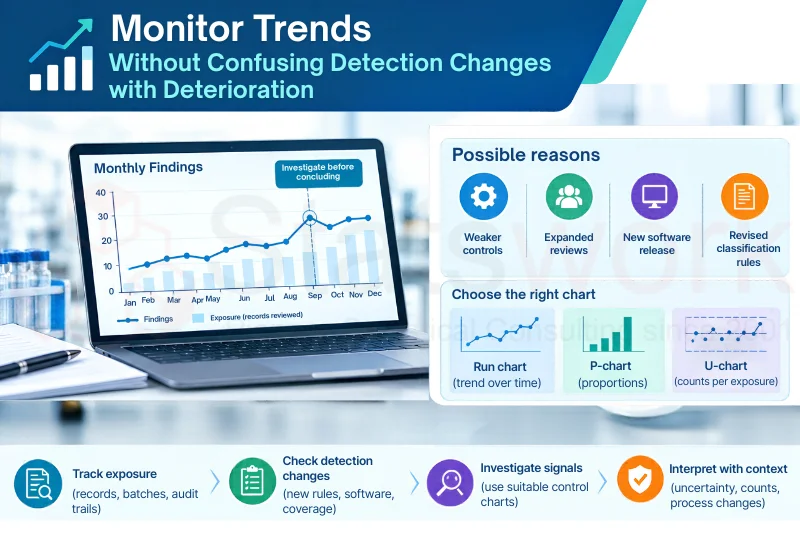
Make use of run charts to analyse trends over time and choose control charts depending on the structure of the data and its denominator: p-chart where subgroup size varies (proportion of non-conformities); u-chart where exposure varies (number of events per unit); and c-chart if exposure is constant (counts). Validate the underlying assumptions and interpret the signals using pre-established guidelines. It is reassuring to see a low number of exceptions, but it does not prove enhanced control effectiveness [8,9].
Evaluate CAPA using comparable follow-up
Corrective and preventive action (CAPA) effectiveness should test whether the original failure mechanism was controlled. Identify the baseline, follow-up period, recurrence parameters, and efficacy cutoff level before looking at any findings.
Let us assume that 90-day periods before and after CAPA yield the following sample numbers:
Indicator | Before CAPA | After CAPA |
Eligible events reviewed | 5,000 | 8,000 |
Confirmed exceptions | 25 | 32 |
Exception rate | 0.50% | 0.40% |
Repeat critical events | 4 | 1 |
The lower exception rate and reduction from four repeat critical events to one are encouraging, but the recurrence counts are descriptive unless event linkage, exposure and observation conditions support stronger inference. The same follow-up duration does not guarantee comparable risk or detection.
Where event counts and exposure permit, compare recurrence rates using a rate ratio and an appropriate confidence interval. With only five critical events across the two periods, uncertainty is substantial. If sufficient chronological observations exist, interrupted time-series analysis may help assess whether the change followed CAPA rather than reflecting a pre-existing trend. Neither approach automatically establishes causation.
Operational example: Repeated audit-trail exceptions show unexplained changes to laboratory results. An investigation links the events to a shared user-access weakness. The site corrects role permissions, reviews potentially affected records and documents product-quality impact. Before implementation, it defines a 90-day effectiveness window, minimum review coverage and a recurrence-escalation rule. At follow-up, the team assesses confirmed recurrence, eligible exposure, review completion and evidence that access controls operate as intended. Any critical recurrence triggers investigation regardless of the overall rate.
This links statistical results to the failure mechanism and documented quality judgement. Statistical significance alone is not a CAPA acceptance criterion. [3]
Map shared evidence to FDA and HPRA expectations
The shared analytical package should retain controlled data definitions, extraction logic, source-record links, reproducible calculations, uncertainty assessments, investigation outcomes and CAPA verification.
For FDA preparation, identify applicable Part 11 provisions and underlying predicate-rule requirements. FDA’s scope-and-application guidance describes its approach to enforcement discretion for specified provisions; it does not remove applicable underlying obligations. [4]
For HPRA preparation, map findings to applicable EU GMP expectations, computerised-system controls, investigation records and CAPA documentation. The relevant inspection scope depends on the manufacturing activity and circumstances. [5] In the audit-trail example, the common analysis identifies the affected system, user role, time period and critical records. The investigation determines potential product-quality impact; the corrective action addresses access permissions; and the effectiveness check assesses recurrence and control performance. Each regulatory evidence view then identifies the relevant requirements and supporting records.
Preserve analytical lineage from extraction and reconciliation through statistical analysis, quality review and regulatory mapping. Where the workflow allows for regulated decision-making, evaluate the validation or verification requirements through the quality system at the site.
A shared evidence base may improve consistency, but it does not ensure regulatory approval or substitute for inspection-specific requirements.
Quantify operational savings
Document the time required for extraction, reconciliation, chart generation, evidence retrieval and report correction. Calculate gross hours avoided as:
Gross Hours Avoided = Baseline Preparation Hours − Post-Implementation Preparation Hours
If preparation time falls from 120 to 85 hours, the gross saving is 35 hours, or approximately 29.2% of baseline preparation time. This is an illustrative calculation, not an industry benchmark.
To calculate the net financial benefit, multiply the total avoided hours by the labour cost rate that is already documented, and then deduct any implementation, maintenance, and training costs. Include errors in reconciling and retrieving evidence. Account for differences in inspection scope and site operations; initial data remediation may increase workload before savings emerge.
One analysis, defensible evidence
Statswork’s data analysis and statistical programming services support pharmaceutical manufacturers with reproducible exception-rate analysis, trend monitoring and CAPA-effectiveness reporting. These deliverables support evidence traceability, informed quality decisions and inspection readiness while preserving separate FDA and HPRA regulatory assessments.
Conclusion
A shared statistical workflow can help Irish pharmaceutical manufacturers quantify data-integrity exceptions, investigate recurring signals and evaluate CAPA while preparing for FDA and HPRA inspections. Defensible denominators, uncertainty estimates, clear event definitions and reproducible calculations strengthen the evidence. Separate regulatory assessments remain essential, and observed statistical improvements must not be overstated.
Frequently Asked Questions (FAQs)
Yes. A shared evidence base can reduce duplicated analysis, but each regulator’s applicable requirements must be assessed separately.
Calculate confirmed exceptions against eligible events reviewed, using consistent definitions and reporting periods. Interpret rates alongside severity and review coverage.
No. Assess recurrence, exposure, review coverage and whether the corrective action addressed the original failure mechanism.
Trend analysis can identify unusual patterns and recurring exceptions while accounting for changing review volumes, detection practices and statistical uncertainty.
No. It can strengthen evidence and traceability, but compliance depends on applicable requirements, effective controls and documented quality-system assessments.
References:
[1] European Commission. EudraLex Volume 4: Good Manufacturing Practice Guidelines. Annex 11: Computerised Systems. January 2011 revision.
https://health.ec.europa.eu/document/download/8d305550-dd22-4dad-8463-2ddb4a1345f1_en?filename=annex11_01-2011_en.pdf
[2] European Commission. Draft Guidelines: Revised Annex 11 — Computerised Systems. 2025 consultation draft.
https://health.ec.europa.eu/document/download/40231f18-e564-4043-94de-c031f813d38b_en?filename=mp_vol4_chap4_annex11_consultation_guideline_en.pdf
[3] Pharmaceutical Inspection Co-operation Scheme (PIC/S). Good Practices for Data Management and Integrity in Regulated GMP/GDP Environments. PI 041-1, 1 July 2021.
https://picscheme.org/docview/4234
[4] US Food and Drug Administration. Part 11, Electronic Records; Electronic Signatures—Scope and Application.
https://www.fda.gov/regulatory-information/search-fda-guidance-documents/part-11-electronic-records-electronic-signatures-scope-and-application
[5] Health Products Regulatory Authority. GMP Inspections—Medicines for Human Use.
https://www.hpra.ie/regulation/human-medicine/manufacturers/good-manufacturing-practice-%28gmp%29-inspections
[6] Office for Health Improvement and Disparities. Public Health Technical Guidance: Proportions and Odds.
https://fingertips.phe.org.uk/static-reports/public-health-technical-guidance/Basic_statistics/Proportions.html
[7] Kharrati-Kopaei M, Dorosti-Motlagh R. Confidence intervals for the ratio of two independent Poisson rates: Parametric bootstrap, modified asymptotic, and approximate-estimate approaches. Statistical Methods in Medical Research. 2020;29(8):2140–2150.
https://doi.org/10.1177/0962280219886889
[8] NIST/SEMATECH. e-Handbook of Statistical Methods: Process or Product Monitoring and Control. National Institute of Standards and Technology.
https://www.itl.nist.gov/div898/handbook/pmc/pmc.htm
[9] NIST/SEMATECH. e-Handbook of Statistical Methods: What Are Attributes Control Charts? National Institute of Standards and Technology.
https://www.itl.nist.gov/div898/handbook/pmc/section3/pmc33.htm