statswork

Stronger Analysis. Smarter Research. Bigger Savings!
Access expert statistical analysis and research support at Flat 24% Off
Stronger Analysis. Smarter Research. Bigger Savings!
Access expert statistical analysis and research support at Flat 24% Off.

Why Does Cpk Drift Go Unnoticed Until an HPRA Inspection? Multivariate SPC for Continued Process Verification

Summary

A process can stay within specification while its statistical behaviour changes. A falling Cpk may be sampling noise, while separate control charts can miss coordinated movement across variables. Cpk confidence bounds, univariate SPC and PCA-based multivariate SPC together give earlier CPV signals and a traceable evidence trail for HPRA inspections.

Most pharmaceutical sites in Ireland can show that every batch met specification. Fewer can show statistically that the process stayed in a state of control between batches. That gap is where Cpk drift hides: capability slides across successive continued process verification (CPV) reviews while every control chart stays within limits, and the trend is first questioned during an HPRA inspection. This article shows how to test a falling Cpk and when multivariate SPC adds evidence that separate charts cannot.

Why a Falling Cpk Is Not Yet Evidence of Deterioration

Cpk compares the distance from the process mean (μ) to the nearest specification limit with three standard deviations (σ):

Cpk = min [ (USL − μ) / 3σ, (μ − LSL) / 3σ]

Cpk is meaningful only for a statistically stable process, and it assumes approximately normal data, which bounded responses such as dissolution often violate. Both conditions should be checked before any trend is interpreted.

Worked example: is the decline real?

Suppose dissolution Cpk moves from 1.45 to 1.38 to 1.31 across three CPV reviews of 30 batches each. Using Bissell’s approximation, the one-sided 95% lower confidence bounds are about 1.12, 1.07 and 1.01 [4, 5]. The bounds overlap heavily, so the point estimates alone do not show that capability has changed.

The example exposes a larger problem. With 30 batches, an observed Cpk of roughly 1.71 is needed before the lower bound clears 1.33. A site reporting “Cpk 1.45, capable” may never have demonstrated its own criterion.

The productive question is mechanistic: has the mean moved toward a limit, has variability increased, or has the data population changed through a new supplier or method transfer? Each answer leads to a different investigation.

Table 1. Evidence layers in CPV and their limits

Layer

Question it answers

What it cannot conclude

Cpk with confidence bound

Is the process capable against specifications?

Whether the process is stable

Univariate SPC

Has one variable shifted or trended?

Whether variables changed jointly

Multivariate SPC

Has joint behaviour become unusual?

Root cause or product impact

Contribution analysis

Which variables are associated with the signal?

Causation, without investigation

Why Univariate SPC Misses Joint Change

Shewhart charts are slow to detect small shifts: with 3σ limits, a sustained 0.5σ shift takes about 155 batches on average to signal [7]. EWMA and CUSUM charts respond faster but still watch one variable at a time.

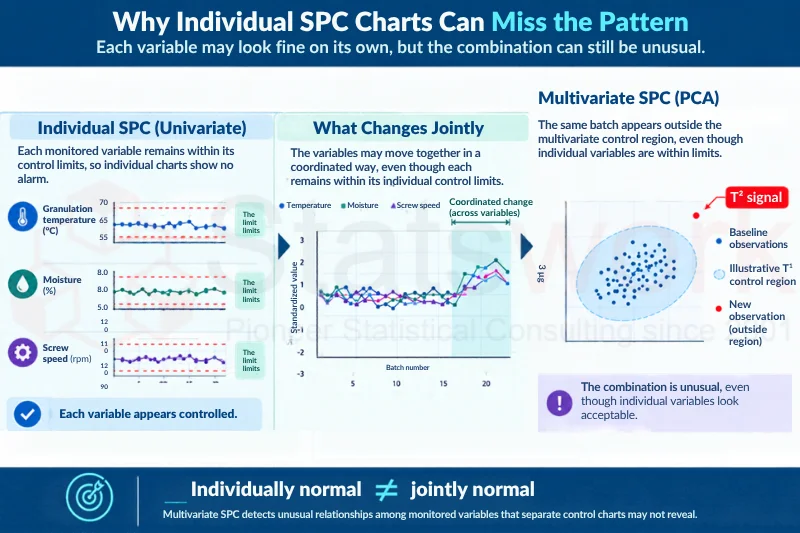
The larger blind spot is correlation. In granulation, temperature, moisture and screw speed are physically linked. Each can drift upward well inside its own limits while the combination becomes unusual (Figure 1). Separate charts also inflate false alarms: ten independent 3σ charts give about a 2.7% chance of a false signal per batch.
continued process verification

Figure 1. Individually normal is not jointly normal. Illustrative schematic, not actual process data.

Multivariate SPC addresses both problems. In PCA-based process monitoring, the scaled data matrix is decomposed as:

X = T Pᵀ + E

where T holds the scores, P the loadings and E the residuals [6]. Hotelling’s T² measures how far an observation lies from the baseline centre within the model. Q, or squared prediction error (SPE), measures how poorly the model reconstructs it.

Table 2. Reading T² and Q/SPE signals together

T²

Q/SPE

Statistical meaning

Typical next step

High

Normal

Usual correlation pattern, but far from the baseline centre

Check for a coordinated shift in set-points or materials

Normal

High

Normal correlation structure has broken

Check for a sensor fault or new source of variation

High

High

Large deviation plus behaviour outside the model

Prioritise investigation and product-impact assessment


Silva et al. applied this approach to continuous twin-screw granulation and fluid-bed drying, detecting imposed disturbances with T² and Q charts [8].

Building an MSPC Model That Holds Up in an Inspection

Fitting PCA to historical data is the easy part. A defensible model documents six decisions:

  1. Objective: link monitored CPPs and material attributes to critical quality attributes through risk assessment.
  2. Reference baseline: use batches representing the intended state of control and justify every exclusion.
  3. Preprocessing and model size: define scaling, missing-data handling and batch alignment; choose components by cross-validation.
  4. Control limits: base T² limits on the F distribution and Q limits on the Jackson–Mudholkar approximation, stating the accepted false-alarm rate [6].
  5. Challenge testing: confirm detection of known disturbances on independent or prospective batches.
  6. Lifecycle rules: define action thresholds and rebuild triggers. Automatic retraining can absorb genuine drift into the baseline.

Explaining 95% of historical variance does not prove sensitivity to small, quality-relevant disturbances; only challenge testing does.

Worked Example: An Irish Solid-Dose Site

A solid-dose manufacturer sees dissolution Cpk fall from 1.45 to 1.31 over three-monthly reviews, while charts for granulation temperature, impeller speed and liquid addition remain within limits.

Verify: the statistician confirms the calculation, normality and data integrity.

Decompose: variability is unchanged, but the mean has moved toward the lower limit. Because Cpk is expressed in units of 3σ, a fall of 0.14 equals a mean shift of about 0.42σ, which a Shewhart chart would take around 190 batches on average to signal.

Model: batches 1–18 sit inside the T² limit; batches 19–22 exceed it while Q/SPE stays normal. Contributions point to temperature and liquid addition.

The conclusion is not “these batches are defective”. The variables are moving together in their usual pattern, but away from the reference centre. That triggers a documented investigation and product-impact assessment, months before an inspector asks

What Makes CPV Evidence Inspection-Ready?

HPRA GMP inspections can cover production, equipment, laboratories and pharmaceutical quality-system records [2]. ICH Q10 treats process-performance monitoring as a means of maintaining a state of control [3]. EU GMP Annex 15 requires ongoing process verification to evaluate process trends using statistical tools where appropriate (sections 5.29, 5.31), and names multivariate statistical process control as a tool that may be used (section 5.24) [1].

MSPC is therefore permitted, not mandated. HPRA inspection readiness depends on a traceable chain from model rationale and baseline to signal, investigation and decision.

Statswork Support

Is a falling Cpk making your CPV evidence hard to defend? Separating sampling noise from genuine drift needs confidence bounds and validated multivariate limits.

Statswork’s data analysis team delivers Cpk analysis, univariate and multivariate SPC model validation, and CPV trend reports written for QA and regulatory review. Talk to a Statswork statistician about your CPV data.

Conclusion

Cpk shows capability, not stability. Confidence bounds test whether a decline is real; multivariate SPC detects coordinated change that separate charts miss. Neither proves a root cause, but together, with a validated baseline and predefined rules, they give continued process verification an earlier, defensible signal.

Frequently Asked Questions (FAQs)

No. Cpk measures capability for a stable process; it cannot show stability or detect coordinated change across variables.

No. EU GMP Annex 15 lists MSPC as a tool that may be used, justified by process complexity, data and risk.

T² measures unusual distance within the PCA model; Q/SPE measures how poorly the model reconstructs an observation.

No fixed number exists, but with 30 batches, the 95% lower bound for an observed Cpk of 1.45 is only about 1.12.

References:

  1. European Commission. EudraLex Volume 4, EU GMP Guidelines, Annex 15: Qualification and Validation (2015). https://health.ec.europa.eu/document/download/7c6c5b3c-4902-46ea-b7ab-7608682fb68d_en?filename=2015-10_annex15.pdf
  2. Health Products Regulatory Authority (HPRA). Good Manufacturing Practice (GMP) Inspections – Human Medicines. https://www.hpra.ie/regulation/human-medicine/manufacturers/good-manufacturing-practice-%28gmp%29-inspections
  3. International Council for Harmonisation. ICH Q10: Pharmaceutical Quality System (2008). https://database.ich.org/sites/default/files/Q10%20Guideline.pdf
  4. Chou, Y. M., Owen, D. B., & Borrego, S. A. (1990). Lower confidence limits on process capability indices. Journal of Quality Technology, 22(3), 223–229. https://doi.org/10.1080/00224065.1990.11979242
  5. Bissell, A. F. (1990). How reliable is your capability index? Journal of the Royal Statistical Society Series C (Applied Statistics), 39(3), 331–340. https://doi.org/10.2307/2347383
  6. Jackson, J. E. (1991). A User’s Guide to Principal Components. https://doi.org/10.1002/0471725331
  7. Montgomery, D. C. (2019). Introduction to Statistical Quality Control (8th ed.). Wiley. https://www.wiley.com/en-us/shop/general-introductory-industrial-engineering/introduction-to-statistical-quality-control-8th-edition-p-9781119399308
  8. Silva, A. F. T., Sarraguça, M. C., Fonteyne, M., Vercruysse, J., De Leersnyder, F., Vanhoorne, V., Bostijn, N., Verstraeten, M., Vervaet, C., Remon, J. P., De Beer, T., & Lopes, J. A. (2017). Multivariate statistical process control of a continuous pharmaceutical twin-screw granulation and fluid bed drying process. International Journal of Pharmaceutics, 528(1–2), 242–252. https://doi.org/10.1016/j.ijpharm.2017.05.075


Contact us