
Role of machine learning in sports for enhancing performance
May 2, 2020
Mixed-method approaches to strengthen economic evaluations in implementation research
May 27, 2020Multivariate Model Building
Meta Analysis Service
Recommended Reads
Contact us
Multivariate Model Building
Data Analysis with more appropriate model is utmost important in any area of study. Building a simple regression model with one dependent and one independent variable is quite easier to do. However, what if you have more than one input variables or the two or more independent variables? That’s where; the multivariate model building in regression analysis comes into the play. In this blog I will discuss about what is a multivariate model and how to build it probably with an application (Montgomery, Peck, & Vining, 2012), a common practice in Statistical Data Analysis Services.
What is a Multivariate Model in Regression Analysis?
A multivariate or multi-variable model is one of the widely used statistical data analysis techniques to predict or forecast the outcomes based on various independent or explanatory variables. Scientists or analysts use this multivariate regression model more often to predict the outcome of the business problems under different circumstances to get more closer look about the status of the business and to avoid risks (Anderson, 1958), often supported by Regression Analysis Services.
How to Build a Multivariate Model? Key Guidelines
Well there are abundant methods are there in developing a multivariate model according to the researchers need. Here, I cannot present you all the available techniques rather I can provide you few thumb rules to be taken care of while doing any multivariate statistical analysis as followed in professional Statistical Data Analysis Services.
Rule 1: Understand the Predictors in Multivariate Regression
First think is to keep in mind is about the predictors. The regression coefficients for each predictor is not actually the full effect, it gives us the marginal effect of the variables. Each regression analysis coefficient has unique effect on the outcome or dependent variable. Make sure no predictors are overlapping by checking it in R squared and F-statistic.
Rule 2: Perform Exploratory Data Analysis Before Model Building
Before you start your model building process, it is important and necessary to understand about the data well. Hence, do some summary statistics, check for missing entries, check for outliers, over or under dispersion, multicollinearity in the data by using suitable graphical methods. Like, checking whether the data attains the bell-shaped curve by simply plotting a histogram, presence of outliers can be identified using residual plots or a scatter plot.
Rule 3: Conduct Correlation and Bivariate Analysis
I recommend doing correlation analysis or crosstabs or any other bivariate descriptive statistical analysis before you go into the main model to understand the predictor variables. By doing so, you will get a better view about why few variables losing its significant while doing the main model.
Rule 4: Choosing the Right Multivariate Model Building Process
Choosing the right process for understanding the predictors. If you are concerned with identifying a cause of the problem you claimed as null hypothesis, and you have more than say 15 variables for this study, then it is advisable to do the model building for different sets of variables to understand the better relationship. One can use step-wise regression in such case, a common approach in Regression Analysis Services.
Rule 5: Interpret the Multivariate Regression Model Results
Understanding the model results and interpret accordingly. Understand the changes in the regression coefficients and R squared values and take decisions accordingly like to remove or keep the variables for further model building process. Often analyst will keep the significant variables and drop off the non-significant variables. In such case, significant for interaction terms should be taken care off. If the interaction is significant, then one cannot drop the non-significant variable from the study. This stage often requires expert Statistical Interpretation Services.
Application of Multivariate Regression Model: Car Price Prediction Example
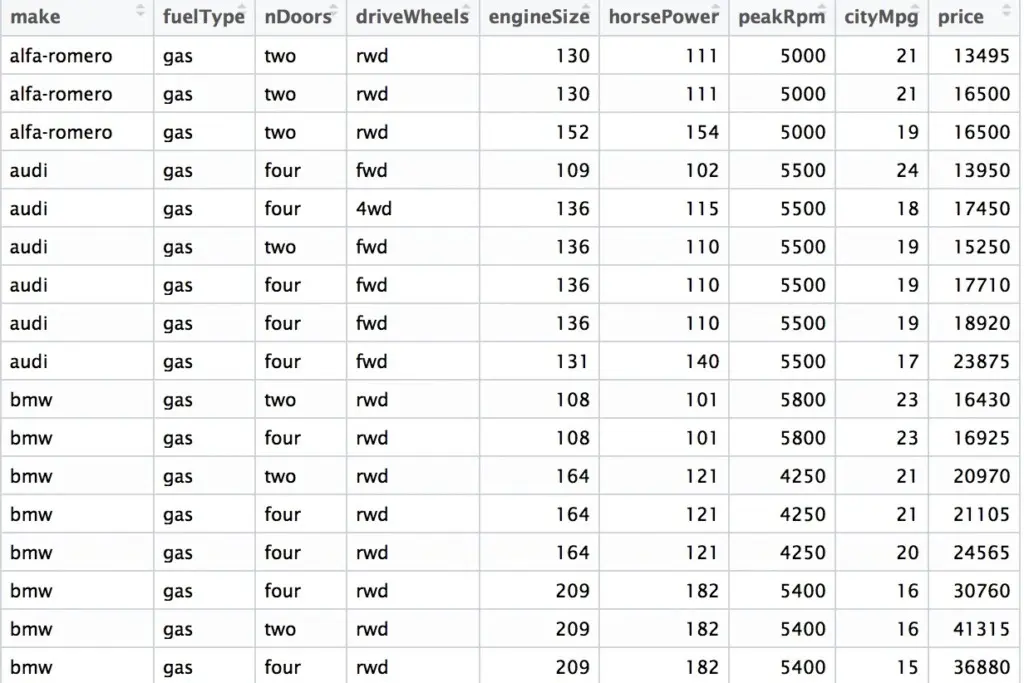
With all these rules or say guideline, one can build a multivariate model. These rules are applicable for all types of models such as ANOVA, mixed models, etc. Let us look at an example where I used multiple regression model building strategy. Consider a problem of studying the impact of the variables on predicting price of a car and following is the sample data used for this analysis (Morrison, 1990).
The multivariate regression model is to estimate or predict the price having the other information’s such as engine size, length, width, height, horsepower, etc.
Multivariate Regression Model Equation
The model is expressed as
y = β0 + β1.x1 + β2.x2 +….. + βn.xn
Here y is the price, x1,x2,…xn are the independent variables, and beta’s are the regression coefficients which we need to find. For this example, the model is expressed as
price = β0 + β1. engine size + β2.horse power + β3. peak RPM + β4.length+ β5.width + β6.height
Statistical Software Output of Multivariate Model
The following is the output of the regression model from a statistical software,
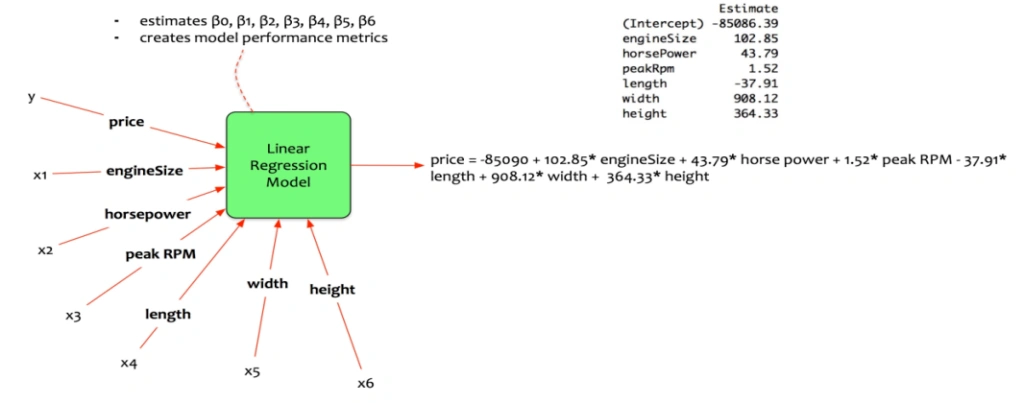
The multivariate linear regression model equation is,
price = -85090 + 102.85 * engineSize + 43.79 * horse power + 1.52 * peak RPM – 37.91 * length + 908.12 * width + 364.33 * height
Interpretation of Multivariate Regression Coefficients
Now next step is to interpret the results accordingly. The following are the valid interpretation from the statistical data analysis, typically delivered through Statistical Interpretation Services.
Regarding Length – Assuming other predictors as constant, average price of the car decreases by 37.91 if the length increased by one unit.
Regarding Horsepower – Assuming other predictors as constant, the average price increases by 43.79 if the horsepower is increased by one unit.
Similarly, one can interpret the results for each predictor. Now, let us look at the model evaluation process.
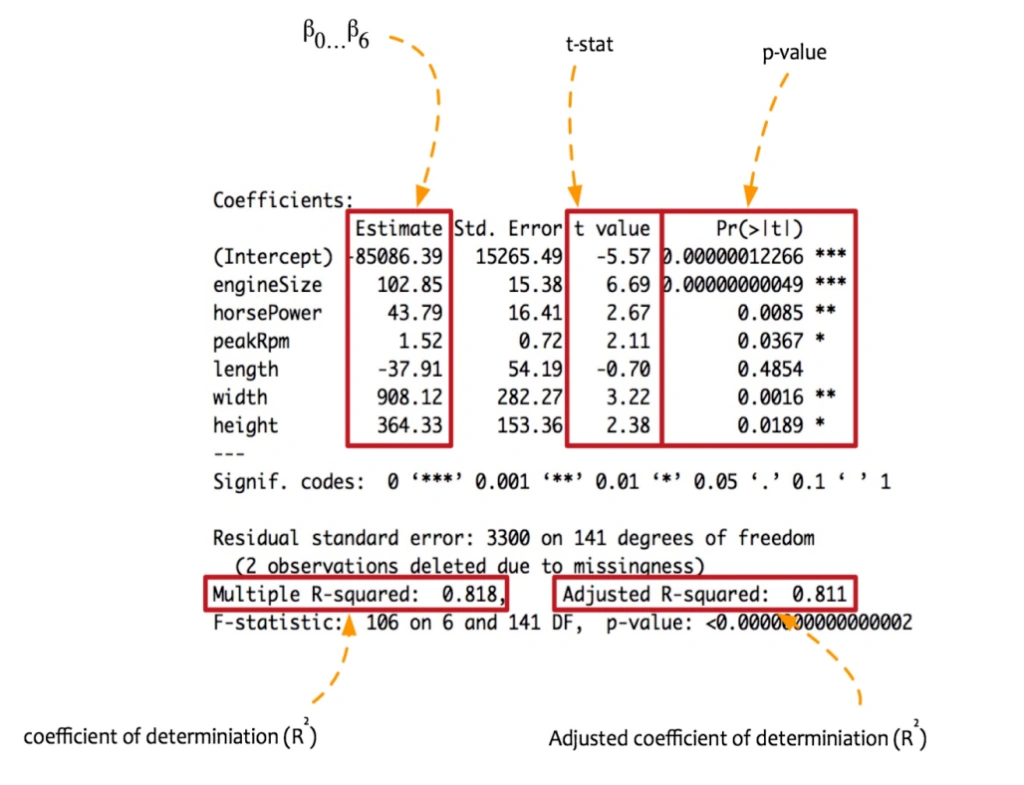
Model Evaluation Using t-value, p-value and Adjusted R Square
The above figure is the result of the estimated values and the significant values for each variable. From the t-value, we can say which variable have impact on the price and which variables doesn’t have an impact. Here, the variable length doesn’t have an impact on the mean price since it is negative. The probability value or the p-value identifies the variables are significant or not with the specific cut-off value. Normally, 0.05 is considered to find the variables are significant or not. The adjusted R square value reveals that the model explains 81% of variation in the data and this implies our model is a good fit (Hair, Black, Babin, Anderson, & Tatham, 2006).
Conclusion: Importance of Multivariate Model in Data Analysis Services
In conclusion, a multivariate model uses multiple variables to predict the outcome. A multivariable model is always making the researchers to make better decision in complex business situations. Multivariable model is not only used for the business understanding, it is used in different fields such as finance, medicine, transport, etc. Building a right model for the right data is the most important task for any statistical data analysis, often supported by Statistical Data Analysis Services, Regression Analysis Services, and Statistical Interpretation Services. Hence, with this note, I hope you all understood the process of building a multivariate model and download a multivariate data from any source and start understanding it (Johnson & Wichern, 2002).
Need help with Multivariate Regression or Statistical Data Analysis? Contact Statswork experts for professional support.
References
- Anderson, T. W. (1958). An introduction to multivariate statistical analysis. Retrieved from http://www.sidalc.net/cgi-bin/wxis.exe/