- Services
- Data Analysis services
- Sample Work

Data Analysis services
- Secondary Qualitative Research Services
- Secondary Quantitative Research Services
- Meta-Analysis Research services
- Sample Work

Meta-Analysis Research Services
- Data Collection Services
- Sample Work

Data Collection Services
- Statistical & Biostatistics services
- Sample Work

Statistical Programming & Biostatistics services
- Data Management Services
- Sample Work

Data Management Services
- Research methodology services
- Sample Work

Research methodology services
- Tool Development Services
- Sample Work

Tool development services
- Statistical Interpretation services
-
Statistical Interpretation services
- Sample Work

Statistical Interpretation services
-
- Sample Size Calculation Services
-
Sample Size Calculation Services
- Sample Work

Sample Size Calculation Services
-
- AI & ML Services
-
Artificial Intelligence and Machine Learning Services
- Sample Work

Artificial Intelligence and Machine Learning Services
-
- Meaningful Visualization Services
- Thought Leadership Services
- Report Generation Services
-
Report generation Service
- Sample Work

Report generation Services
-
- Data Analysis services
- Industries
- About Us
- Blog
- Insights
- Contact Us
- Services
- Data Analysis services
- Sample Work
Data Analysis services
- Secondary Qualitative Research Services
- Secondary Quantitative Research Services
- Meta-Analysis Research services
- Sample Work
Meta-Analysis Research Services
- Data Collection Services
- Sample Work
Data Collection Services
- Statistical & Biostatistics services
- Sample Work
Statistical Programming & Biostatistics services
- Data Management Services
- Sample Work
Data Management Services
- Research methodology services
- Sample Work
Research methodology services
- Tool Development Services
- Sample Work
Tool development services
- Statistical Interpretation services
-
Statistical Interpretation services
- Sample Work
Statistical Interpretation services
-
- Sample Size Calculation Services
-
Sample Size Calculation Services
- Sample Work
Sample Size Calculation Services
-
- AI & ML Services
-
Artificial Intelligence and Machine Learning Services
- Sample Work
Artificial Intelligence and Machine Learning Services
-
- Meaningful Visualization Services
- Thought Leadership Services
- Report Generation Services
-
Report generation Service
- Sample Work
Report generation Services
-
- Data Analysis services
- Industries
- About Us
- Blog
- Insights
- Contact Us
From One-Way to N-Way ANOVA: Choosing the Right Test for Your Data
- Home
- Blog
- From One-Way to N-Way ANOVA: Choosing the Right Test for Your Data
Qualitative Research Service
- Understanding ANOVA and Why It Is Important in Data Analysis
- When and How to Use One-Way ANOVA
- Exploring Two-Way ANOVA and Interaction effects
- Moving to N-Way ANOVA for Complex Data Analysis
- Key Assumptions You Must Check Before Applying ANOVA
- Interpreting ANOVA Results and Performing Post-Hoc Tests
- Step-by-Step Guide to Performing ANOVA for Accurate Data Analysis
- Conclusion
Recommended Reads
Contact us
From One-Way to N-Way ANOVA: Choosing the Right Test for Your Data
In research and data analysis, comparisons of distinct groups are required to be done effectively to achieve accurate and reliable results. With the help of ANOVA statistical tests, it is possible to analyze whether the variations existing between the distinct groups can be considered significant or not. One-way ANOVA, two-way ANOVA, n-way ANOVA, are powerful tools for conducting analysis of variance tests for research purposes, depending upon the factors of different variables and data complexity involved.[1]
Understanding ANOVA and Why It Is Important in Data Analysis
ANOVA, analysis of variance in research, is a statistical technique used to evaluate the means of three or more groups to analyze the significance of the differences that exist amongst them. ANOVA is a statistical analysis service that is used in assorted studies in the fields of academics, commerce, and science, etc. This is because the statistical test helps evaluate complex data accurately without any errors resulting from the ANOVA technique. It is an integral part of the ANOVA statistical technique used to analyze the results of a study. [2]
Types of ANOVA:
- One-Way ANOVA: It is applied if there is one independent variable to affect the output. It is useful for simple group comparisons.
Example – Comparing students’ exam scores based on three different teaching methods using quantitative data analysis services.
- Two-way ANOVA: Used when there are two independent variables involved and could consider both individual effects as well as interaction effects.
Example – Studying employee productivity based on work environment and experience level using data analysis services.
- N-Way ANOVA: This is applied for analyzing data that consists of three or more variables. It makes data analysis more detailed. [2]
Example – Analyzing patient recovery time based on treatment type, age group, and diet plan using qualitative data analysis services
When and How to Use One-Way ANOVA
The one-way ANOVA technique is one of the methods that helps compare more than two groups based on the results of one independent variable’s impact on the data sets, searching for the differences that are statistically significant. This ANOVA test is one of the most used tests for the statistical analysis services in research and assists in choosing the right test for simple data analysis with the correct interpretation of results. [3]
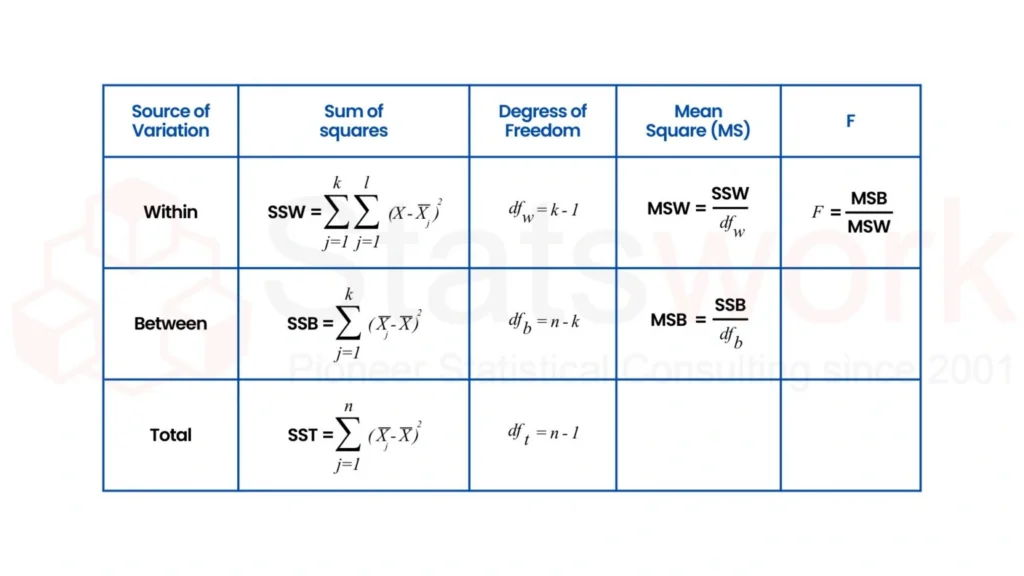
Figure 1: ANOVA Table Structure and Formula Representation
Exploring Two-Way ANOVA and Interaction effects
- Two-way ANOVA refers to when in one data set, the presence of two independent variables affects one dependent variable.[4]
- This ANOVA statistical test helps the researcher in analysis of variance by examining the individual effect of each variable on the outcome.
- It also recognizes interaction effects that indicate how one variable may influence the effect of another in ANOVA for research analysis.
- Reasons being that, if the ANOVA analysis is done step by step and if ANOVA test interpretation is also appropriately done, then the researchers can better understand complex data relationships using data analysis services.
- This will help analysts and students to select the appropriate ANOVA test to analyze data accurately and in detail using quantitative data analysis services.
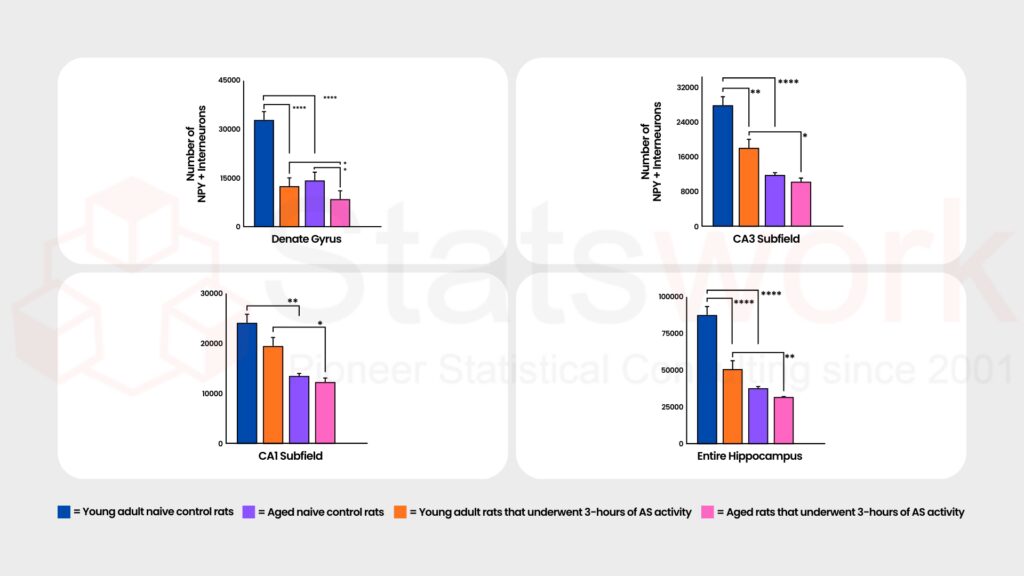
Figure 2: Comparison of NPY+ Interneuron Counts Across Hippocampal Regions
Moving to N-Way ANOVA for Complex Data Analysis
N-way ANOVA is a rigorous statistical analysis service that is used when three or more independent variables are fixed for one dependent variable.
- It is commonly applied in analysis of variance studies to observe different factors’ effects on the findings.
- This method is significant in ANOVA used in the analysis of the research when the data is intricate with numerous variables.
- N-way ANOVA facilitates the identification of individual variables and interaction effects for deeper insights using qualitative data analysis services [2]
- By following a step-by-step guide on ANOVA analysis, researchers can analyze the complex data effectively with data analysis services.
- Understanding this method helps analysts and students in identifying which ANOVA test to use to conduct comprehensive quantitative data analysis services.
Key Assumptions You Must Check Before Applying ANOVA
| Assumption | Description |
| Normality | The data should be normally distributed to obtain true results from the ANOVA statistical test. |
| Equal Variance | The group variances used in the study should be similar for proper statistical analysis services. |
| Independence | Observations should be independent in ANOVA for the analysis. |
| Continuous Data | The dependent variable must be numerical to enable interpretation of ANOVA test results.[1] |
| Right Test Selection | Assumption checking helps us select the right ANOVA test. |
Interpreting ANOVA Results and Performing Post-Hoc Tests
The output of the one-way ANOVA test is analyzed to identify the significance level of the data with the help of the F and p values obtained in the test results.
- In the analysis of variance test, if a p-value is less than 0.05, then at least one of the means differs significantly.
- ANOVA indicates the presence of the difference, but it does not specify which group the differences occur in. ANOVA in Research Analysis
- To perform group comparisons and observe where the differences are, post hoc tests like Tukey’s or Bonferroni’s can be conducted.[4]
- Correct interpretation of the ANOVA test and drawing the right conclusions can be achieved by following the step-by-step guide for ANOVA analysis.
- The process assists researchers in selecting the appropriate test for the right ANOVA test, thus enhancing their research reliability.
Choosing the Right ANOVA Test for Your Research or Data
It is of utmost importance to choose the appropriate statistical test, which in this case is the ANOVA statistical test, to analyze the results of the variance in the research as accurately as possible. Understanding your variables by using a step-by-step guide to perform an ANOVA analysis helps you in choosing the appropriate test, hence yielding appropriate results in the process.[2]
Step-by-Step Guide to Performing ANOVA for Accurate Data Analysis
Step 1: Define the Research Question
Specify clearly what you want to analyze and what the variables are, specifically the dependent and independent variables, for the ANOVA test.[1]
Step 2: Choose the Right Type of ANOVA
Select one-way ANOVA, two-way ANOVA, n way ANOVA based on the number of independent variables used in your analysis of variance.
Step 3: Collect and Organize Data
Collect your data and organize it in groups or categories for accurate ANOVA in conducting research.
Step 4: Check ANOVA Assum
Check for normal distribution, equal variance, and independence.
Step 5: Perform the ANOVA
Evaluate Using statistical software like Excel, SPSS, R, Python, calculate the F-value and p-value by following the step-by-step guide for ANOVA.
Step 6: Interpret the Results
The interpretation of the results should be done by checking the p-value of the test, which is used to determine whether significant differences exist.
Step 7: Perform post-Hoc.
Tests (If Needed) Results, if statistically significant, then can be followed by post-hoc testing with Tukey, Bonferonni, to determine.
Step 8: Draw Conclusions and Report Findings
Summarize your results, and verify you are selecting the appropriate ANOVA test for correct interpretations using quantitative data analysis services.
Conclusion:
For this reason, the ANOVA test is believed to play a crucial role in variance analysis of research, undertaking multiple comparisons and identification of the presence of significant differences among those various groups. Understanding one-way ANOVA, two-way ANOVA, and n-way ANOVA will be helpful for the selection of the appropriate ANOVA test using data analysis services. This approach always guarantees valid ANOVA test interpretation using statistical analysis services.[4]
Reference:
- Okoye, K., & Hosseini, S. (2024). Analysis of variance (ANOVA) in R: one-way and two-way ANOVA. In R programming: statistical data analysis in research(pp. 187-209). Singapore: Springer Nature Singapore.https://link.springer.com/chapter/10.1007/978-981-97-3385-9_9
- Bagozzi, R. P., & Yi, Y. (1989). On the use of structural equation models in experimental designs. Journal of marketing Research, 26(3), 271-284.https://journals.sagepub.com/doi/abs/10.1177/00222437890260030
- De Muth, J. E. (2009). Overview of biostatistics used in clinical research. American Journal of Health-System Pharmacy, 66(1), 70-81.https://academic.oup.com/ajhp/article-abstract/66/1/70/5130237