
- Services
- Data Analysis services
- Sample Work
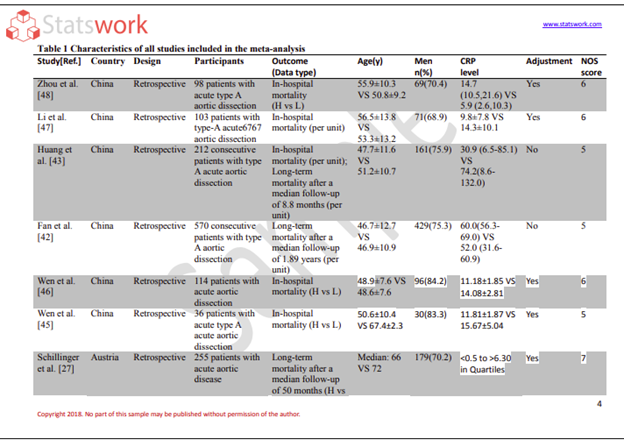
Data Analysis services
- Secondary Qualitative Research Services
- Secondary Quantitative Research Services
- Meta-Analysis Research services
- Sample Work
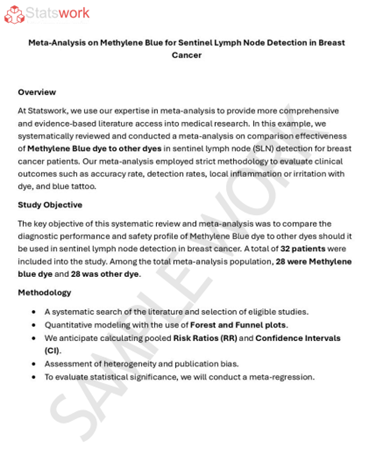
Meta-Analysis Research Services
- Data Collection Services
- Sample Work
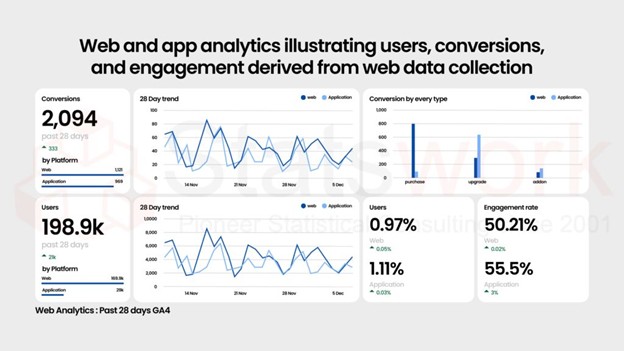
Data Collection Services
- Statistical & Biostatistics services
- Sample Work
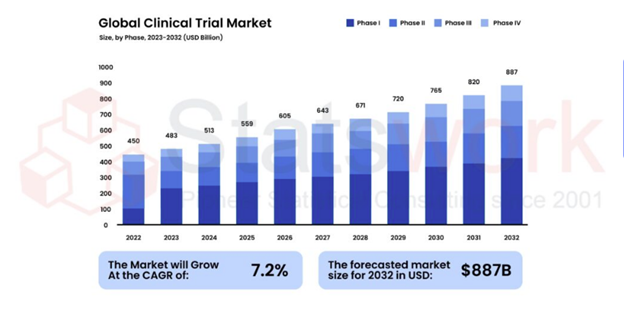
Statistical Programming & Biostatistics services
- Data Management Services
- Sample Work
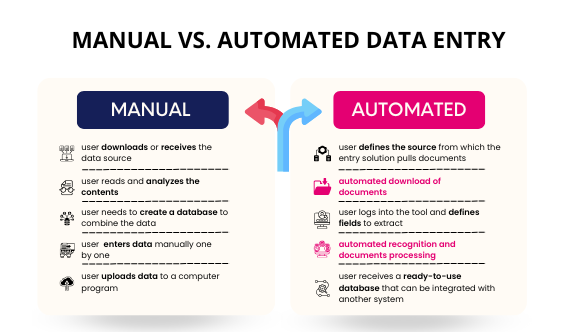
Data Management Services
- Research methodology services
- Sample Work
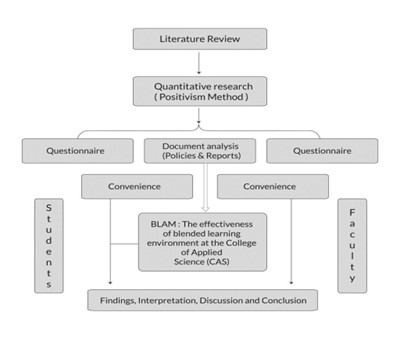
Research methodology services
- Tool Development Services
- Sample Work
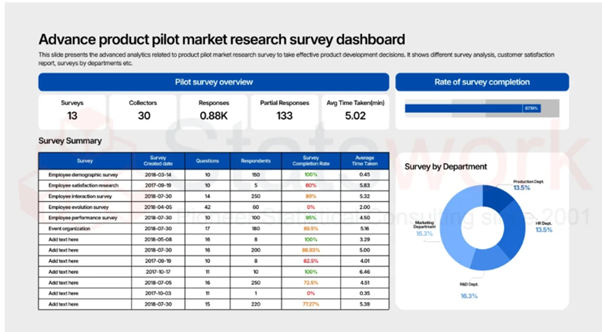
Tool development services
- Statistical Interpretation services
-
Statistical Interpretation services
- Sample Work
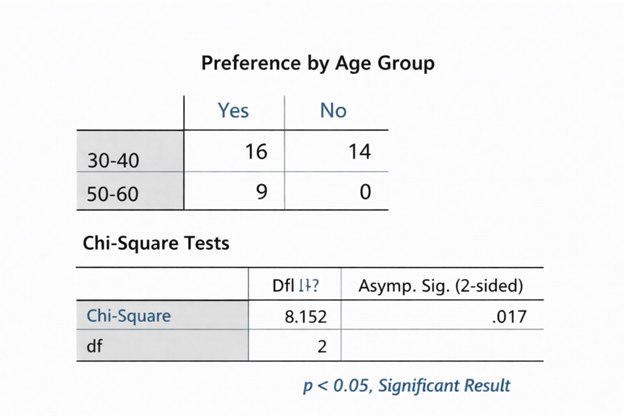
Statistical Interpretation services
-
- Sample Size Calculation Services
-
Sample Size Calculation Services
- Sample Work
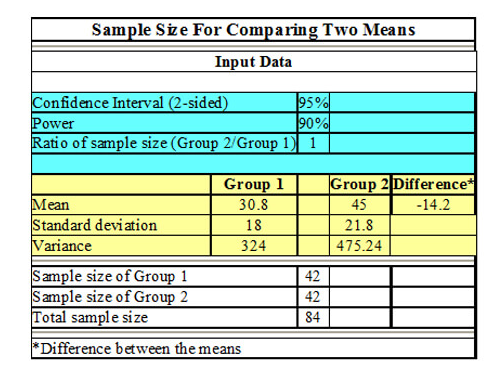
Sample Size Calculation Services
-
- AI & ML Services
-
Artificial Intelligence and Machine Learning Services
- Sample Work
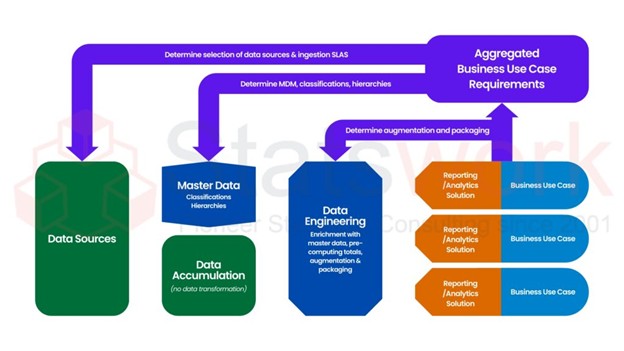
Artificial Intelligence and Machine Learning Services
-
- Meaningful Visualization Services
- Thought Leadership Services
- Report Generation Services
-
Report generation Service
- Sample Work
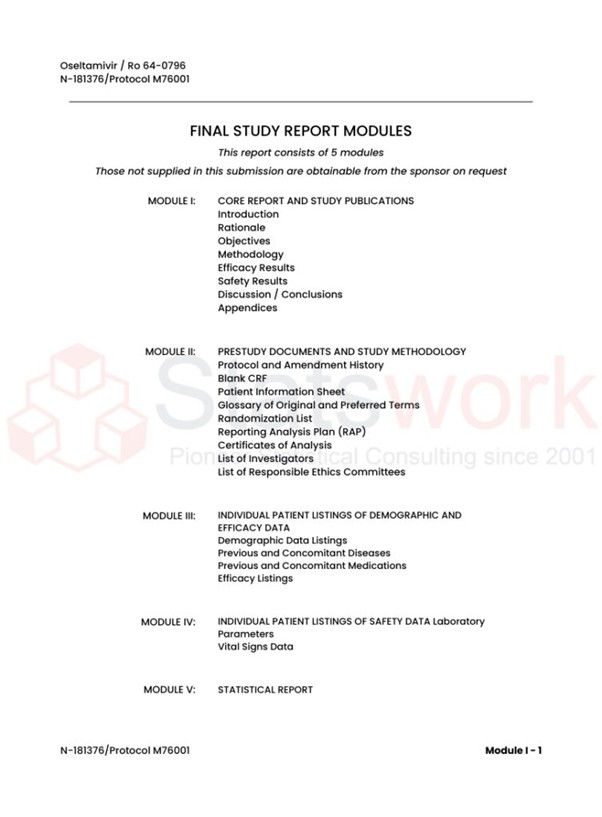
Report generation Services
-
- Data Analysis services
- Industries
- About Us
- Blog
- Insights
- Contact Us
- Services
- Data Analysis services
- Sample Work
Data Analysis services
- Secondary Qualitative Research Services
- Secondary Quantitative Research Services
- Meta-Analysis Research services
- Sample Work
Meta-Analysis Research Services
- Data Collection Services
- Sample Work
Data Collection Services
- Statistical & Biostatistics services
- Sample Work
Statistical Programming & Biostatistics services
- Data Management Services
- Sample Work
Data Management Services
- Research methodology services
- Sample Work
Research methodology services
- Tool Development Services
- Sample Work
Tool development services
- Statistical Interpretation services
-
Statistical Interpretation services
- Sample Work
Statistical Interpretation services
-
- Sample Size Calculation Services
-
Sample Size Calculation Services
- Sample Work
Sample Size Calculation Services
-
- AI & ML Services
-
Artificial Intelligence and Machine Learning Services
- Sample Work
Artificial Intelligence and Machine Learning Services
-
- Meaningful Visualization Services
- Thought Leadership Services
- Report Generation Services
-
Report generation Service
- Sample Work
Report generation Services
-
- Data Analysis services
- Industries
- About Us
- Blog
- Insights
- Contact Us
Need for quantitative data analysis in research and analytical tools used for quantitative research
Meta Analysis Service
Recommended Reads
Contact us
Summary:
The blog post provides an understanding of the need for performing a quality quantitative data analysis and how it should be done. It gives information about what quantitative analysis entails, why it is important (objectivity, generalization, testing), the process of developing a quality data analysis plan including identifying the research problem up to presenting the findings, and finally the strengths and weaknesses of quantitative data analysis relative to qualitative data analysis. Finally, the post compares the top quantitative data analysis tools available in the market namely SPSS, STATA, R, Python, and Power BI that businesses can use depending on their needs.
Introduction
All good conclusions are based on good numbers. Quantitative data analysis refers to the analysis of raw data in numeric form, obtained through surveys, experiments, or any other source, to provide information to answer the research question. Through techniques such as descriptive statistics, inferential statistics, regression analysis, and hypothesis testing, researchers learn to rely not just on opinion but on data. It is thus becoming increasingly essential to understand the reasons for conducting quantitative analysis and how to do it.
Why Quantitative Data Analysis Matters in Research
In quantitative research, a specified sample population is studied through data that can be enumerated, quantified, and statistically analysed [1]. Quantitative methods are well suited to measuring predefined variables, estimating relationships, comparing groups, and testing statistical hypotheses. Questions focused primarily on experiences, meanings, or underlying perceptions may require qualitative methods or a mixed-methods design.
| Reason | Importance |
|---|---|
| Objectivity | Quantitative analysis provides standardized numerical measures that can support more consistent comparisons and statistical evaluation |
| Generalizability | Findings may be generalized to the target population when the sampling strategy, study design, measurement, and analysis appropriately support such generalization. |
| Testability | Statistical hypothesis testing provides evidence for assessing whether the observed data are consistent with a specified null hypothesis [2]. |
| Comparability | Descriptive statistics such as means and percentages can facilitate comparisons between groups and help summarize changes over time |
| Scalability | The analysis of large data sets from survey analysis to corporate analysis is possible with the help of statistical packages. |
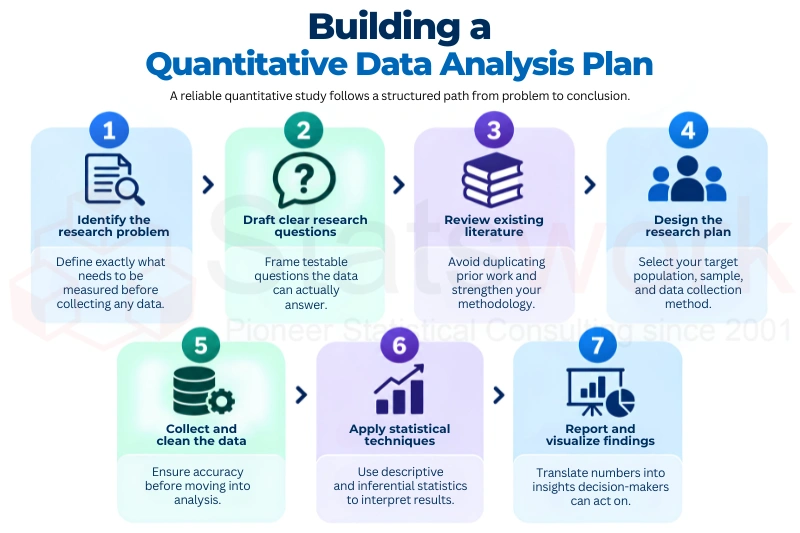
Advantages and Limitations
Strengths:
- Quantitative approaches can address research questions involving measurable variables, numerical comparisons, relationships, and estimated effects.
- A structured quantitative approach can support reproducible and reliable findings when appropriate study design, measurement, sampling, and analytical methods are used.
- Findings may be generalizable to the target population when the sampling strategy, study design, measurement, and analysis appropriately support such generalization [3].
- Data analysis becomes easier to benchmark.
Weaknesses:
- Cannot address the “why” and “how” of human behaviours or perceptions.
- Attitudes and views are not easy to measure quantitatively.
Top Analytical Tools for Quantitative Research
Choosing the right statistical software is central to any quantitative study. Each tool suits different data sizes, skill levels, and analytical goals:
| Tools | Best for |
|---|---|
| SPSS | Easy to use and very user friendly; best suited for analysing survey data as well as descriptive and inferential statistics. |
| STATA | Analyses using commands through four different windows (command window, results window, review window, variables window); very effective in analysing simple and complex statistical models. |
| R | R is free and open-source, highly flexible, and well suited to regression analysis and statistical modelling [2]. |
| Python | Includes both statistical analysis as well as machine learning. |
| Power BI | Data visualization and interactive dashboards from analysis results. |
These tools support different stages of quantitative analysis, but their capabilities, workflows, programming requirements, visualization features, and suitability for specific statistical methods differ. Tool selection should therefore depend on the research design, analytical requirements, user expertise, and reporting needs. Organizations dealing with large or repeatedly collected datasets may find it more efficient to use corporate data analytics or business-oriented statistical analysis services when specialized expertise is not available in-house.
The choice of analytical tool depends on the complexity of the data, the technical expertise of the team, and how the analysis results will be used [3]. While a university dissertation may use SPSS or STATA for statistical analysis and regression modelling. The validity of a regression model depends on the research design, variable specification, assumptions, diagnostics, and interpretation rather than on the software alone. A corporate analytics team monitoring KPIs regularly may use Python for advanced analysis and Power BI for business intelligence, interactive dashboards, reporting, and data visualization.
Software selection is only one component of rigorous quantitative analysis. Analysts should also assess data quality, missing data, outliers, variable definitions, model assumptions, effect sizes, confidence intervals, and potential confounding. Where appropriate, statistical power and sensitivity analyses can help evaluate the robustness of findings. Statistical significance should be interpreted alongside effect magnitude, uncertainty, and practical relevance
Conclusion
Quantitative data analysis provides a structured way to examine numerical evidence, evaluate relationships, compare groups, estimate effects, and address research questions. Reliable findings depend on appropriate study design, sampling, data quality, statistical methods, and interpretation. Selecting the appropriate sampling strategy, statistical software, analytical method, and interpretation approach can be challenging, particularly for complex research projects.
Get Expert Help With Your Quantitative Research
Don’t let complex statistics or the wrong software slow your research down. Our expert statisticians provide end-to-end quantitative research analysis services — from study design and sample selection to SPSS, STATA, R, and Python-based analysis and reporting.
Request a free consultation today and get your data analysed the right way.
Frequently Asked Questions (FAQs)
Common tools for quantitative data analysis include SPSS, R, Python, SAS, Stata, Excel, and Minitab.
The seven steps of data analysis are defining the research question, collecting data, cleaning and preparing data, exploring the data, analyzing the data, interpreting the results, and communicating the findings.
Five examples of quantitative data are age, income, height, weight, and test scores, because they can be measured numerically.
The purpose of quantitative data analysis is to identify patterns, measure relationships, test hypotheses, and support evidence-based research conclusions using numerical data.
The seven main types of quantitative research are descriptive, correlational, experimental, quasi-experimental, causal-comparative, survey, and longitudinal research.
Quantitative data analysis is the systematic process of examining numerical data using statistical methods to identify patterns, relationships, trends, and meaningful research findings.
References:
- Lim, W. M. (2025). What is quantitative research? An overview and guidelines. Australasian Marketing Journal, 33(3), 325-https://journals.sagepub.com/doi/
- Almusaed, A., Almssad, A., & Yitmen, I. (2025). Introduction to quantitative research. In Practice of Research Methodology in Civil Engineering and Architecture: A Comprehensive Guide (pp. 489-528). Cham: Springer Nature http://link.springer.com/chapter/10.1
- Khatun, T. (2026). Qualitative vs Quantitative Research What’s the Difference?. https://www.researchgate.net/profile