
- Services
- Data Analysis services
- Sample Work
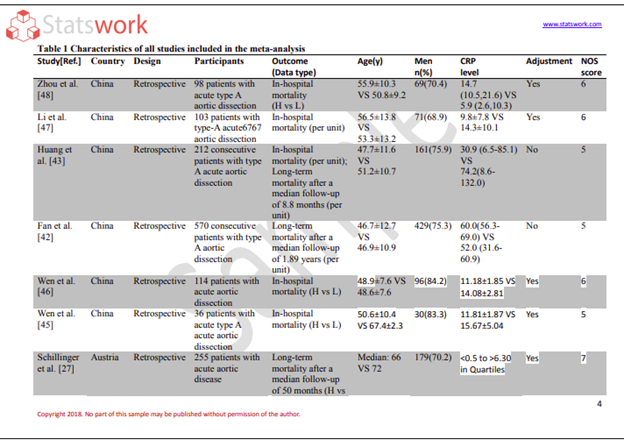
Data Analysis services
- Secondary Qualitative Research Services
- Secondary Quantitative Research Services
- Meta-Analysis Research services
- Sample Work
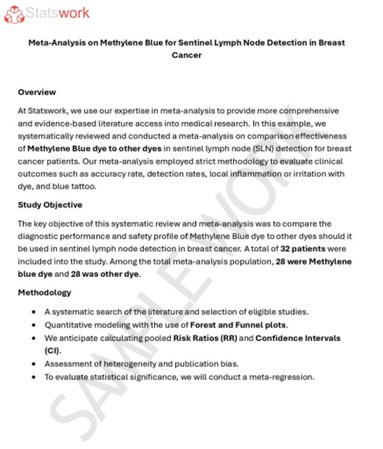
Meta-Analysis Research Services
- Data Collection Services
- Sample Work
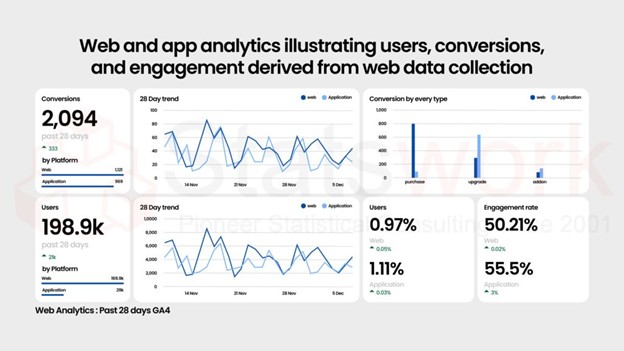
Data Collection Services
- Statistical & Biostatistics services
- Sample Work
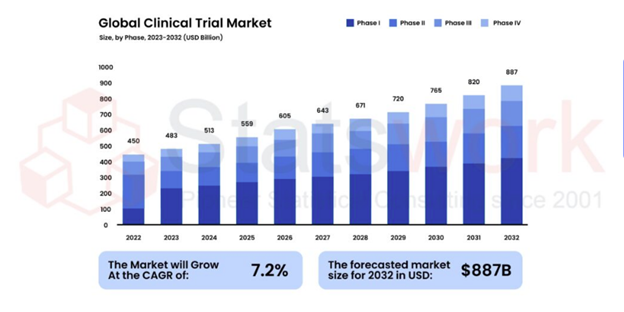
Statistical Programming & Biostatistics services
- Data Management Services
- Sample Work
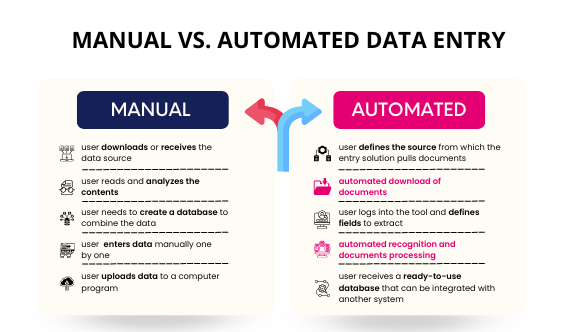
Data Management Services
- Research methodology services
- Sample Work
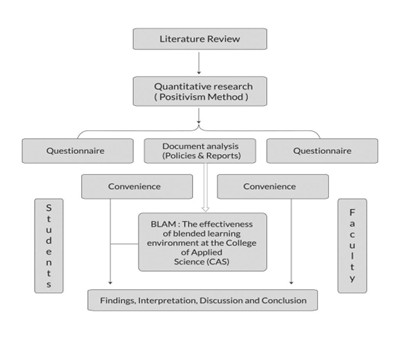
Research methodology services
- Tool Development Services
- Sample Work
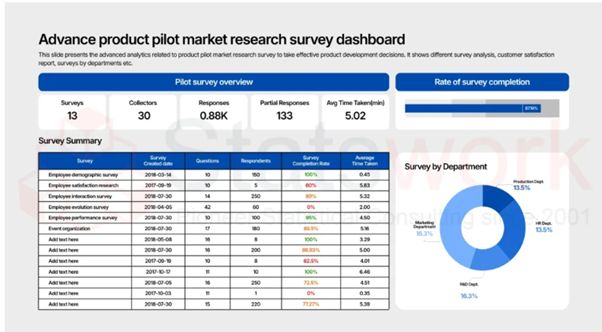
Tool development services
- Statistical Interpretation services
-
Statistical Interpretation services
- Sample Work
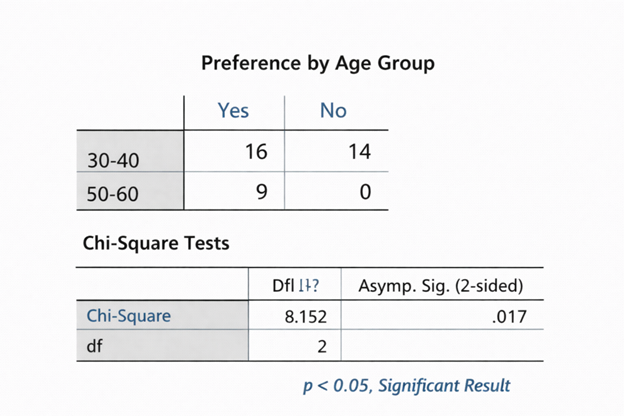
Statistical Interpretation services
-
- Sample Size Calculation Services
-
Sample Size Calculation Services
- Sample Work
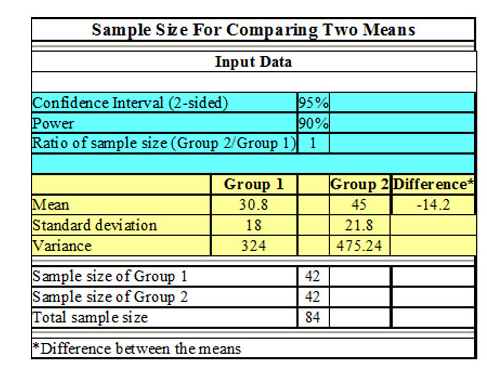
Sample Size Calculation Services
-
- AI & ML Services
-
Artificial Intelligence and Machine Learning Services
- Sample Work
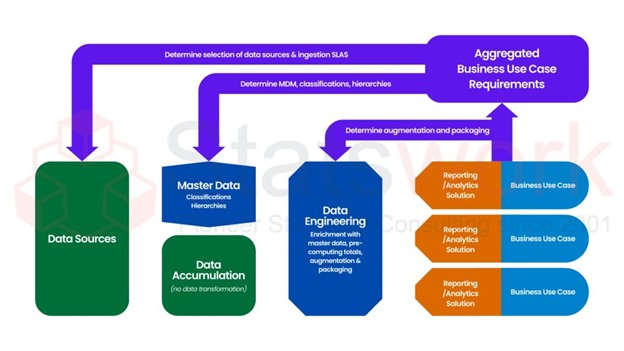
Artificial Intelligence and Machine Learning Services
-
- Meaningful Visualization Services
- Thought Leadership Services
- Report Generation Services
-
Report generation Service
- Sample Work
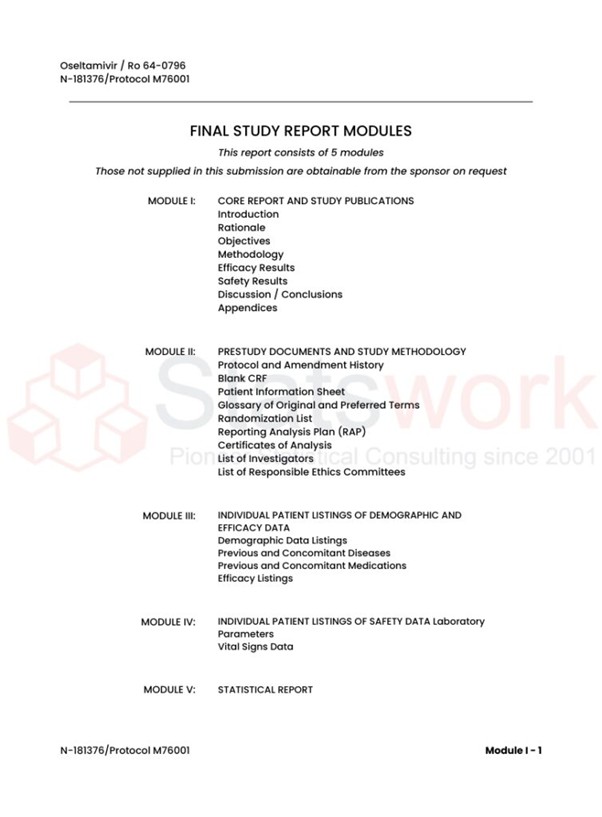
Report generation Services
-
- Data Analysis services
- Industries
- About Us
- Blog
- Insights
- Contact Us
- Services
- Data Analysis services
- Sample Work
Data Analysis services
- Secondary Qualitative Research Services
- Secondary Quantitative Research Services
- Meta-Analysis Research services
- Sample Work
Meta-Analysis Research Services
- Data Collection Services
- Sample Work
Data Collection Services
- Statistical & Biostatistics services
- Sample Work
Statistical Programming & Biostatistics services
- Data Management Services
- Sample Work
Data Management Services
- Research methodology services
- Sample Work
Research methodology services
- Tool Development Services
- Sample Work
Tool development services
- Statistical Interpretation services
-
Statistical Interpretation services
- Sample Work
Statistical Interpretation services
-
- Sample Size Calculation Services
-
Sample Size Calculation Services
- Sample Work
Sample Size Calculation Services
-
- AI & ML Services
-
Artificial Intelligence and Machine Learning Services
- Sample Work
Artificial Intelligence and Machine Learning Services
-
- Meaningful Visualization Services
- Thought Leadership Services
- Report Generation Services
-
Report generation Service
- Sample Work
Report generation Services
-
- Data Analysis services
- Industries
- About Us
- Blog
- Insights
- Contact Us
Steps in Quantitative Data Analysis
Meta Analysis Service
Recommended Reads
Contact us
Summary:
Data analysis is the procedure in which numerical data is analyzed through various forms of statistical analysis to generate useful insights and make decisions from the findings. This process is systematic and entails such steps as collecting data, cleaning it, analyzing it, interpreting it, and visualizing it. Data can be converted to useful information by software such as SPSS, R, Python, and Excel.
Modern companies receive huge amounts of structured data through their business processes, customer service, financial, operational, marketing, and online activities. Nevertheless, simply collecting data is not enough to add business value. To do so, companies need to perform a quantitative analysis of the received information using a systematic approach.
Quantitative data analysis involves application of statistical techniques to assess numerical data, identify trends, test hypotheses, and predict outcomes. Businesses use quantitative analysis in all situations where they need objective evidence to make decisions – from customer satisfaction surveys to health care analytics and financial forecasting [1].
This article provides information on the process of quantitative data analysis, statistical methods used for this purpose, tools available, and how companies can benefit from professional quantitative data analysis services.
What is Quantitative Data Analysis?
Quantitative data analysis is the systematic process of gathering, organizing, analyzing and interpretation of numerical data using statistical methods.
Some examples of use of quantitative data analysis in the business environment include:
- Satisfaction surveys
- Market research
- Financial forecasting
- Product analysis
- Employee engagement studies
- Healthcare and clinical research
Example
A retail company surveys 5,000 customers after launching a new product. Rather than reviewing individual responses manually, statistical analysis identifies purchasing trends, customer satisfaction levels, and demographic preferences.
7 Steps in Quantitative Data Analysis
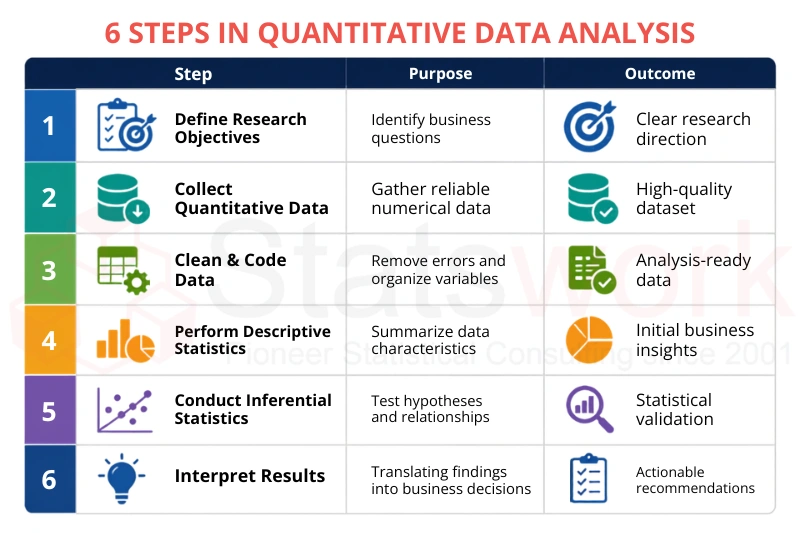
Step 1: Define Research Objectives
A successful quantitative data analysis process starts off by defining the research objective. Businesses need to determine:
- The problem to solve
- The variables to measure
- The target population
- The business decision to be made based on the result [3]
Example
Instead of asking:
“Are customers satisfied?”
A measurable objective would be:
“Determine whether delivery speed significantly influences customer satisfaction scores.”
Clearly defined objectives reduce unnecessary analysis and improve research accuracy.
Step 2: Collect Quantitative Data
The next step is to obtain numeric data from the right sources after setting the research objectives.
Sources for obtaining numeric data
- Online surveys
- Customer feedback forms
- CRM database
- ERP database
- Financial data
- Internet of Things
- Website analytics
- Experiments [4]
Sample Size Determination
Selecting an appropriate sample size determination method ensures reliable results and minimizes sampling error.
Larger datasets generally improve statistical confidence while reducing bias.
Step 3: Clean, Code, and Prepare Data
The datasets may at times be riddled with inconsistencies that may have an impact on the accuracy of statistical analysis.
Data preparation
- Duplicate data elimination
- Missing data handling
- Outlier identification
- Data standardization
- Data coding
- Response validation
Example
Survey responses such as:
- Male / M / m
may all be coded into a single standardized category before analysis.
Step 4: Perform Descriptive Statistics
Descriptive statistics are statistics that describe the primary features of a data set before further analysis is performed.
Some common descriptive statistics are
- Mean
- Median
- Mode
- Standard deviation
- Frequency distribution
- Percentage analysis
These statistics give an overall summary of the trends in the data without making any inference on the population.
Example
A company surveys 2,000 customers.
Results show:
- Average satisfaction score: 4/10
- 72% would recommend the brand
- Average purchase frequency: 6 orders/year
These findings help managers understand overall customer behavior.
Step 5: Conduct Inferential Statistics
After summarizing data, analysts perform inferential statistics to test research hypotheses and determine whether observed relationships are statistically significant.
Common quantitative data analysis methods include
| Statistical Method | Business Use |
| Hypothesis Testing | Validate assumptions |
| Correlation Analysis | Measure relationships between variables |
| Regression Analysis | Predict future outcomes |
| ANOVA | Compare multiple groups |
| t-Test | Compare two groups |
| Chi-Square Test | Analyze categorical variables |
Example
A business wants to know whether advertising expenditure affects monthly sales.
Using regression analysis, analysts discover:
- Every 10% increase in advertising increases sales by approximately 6%.
This relationship supports future budget planning.
Step 6: Interpret Results
Statistical output becomes meaningful when the interpretation is done.
Interpretation means analyzing the following:
- Significance of results
- Confidence intervals
- Business implications
Limitations of research Statistical output becomes meaningful when the interpretation is done [3].
Example
Suppose hypothesis testing shows:
Customer response time significantly affects satisfaction (p < 0.05).
Business interpretation:
Reducing customer support response times is likely to improve customer satisfaction and retention.
Good interpretation connects statistical evidence directly to business strategy.
Step 7: Visualize and Report Findings
The decision-makers understand graphs more quickly than statistics table.
Effective methods for visualization of data
- Bars graph
- Pie chart
- Scatter graph
- Heat map
- Dashboards
- Trend lines
- Histogram
Visualization of data makes the process of communication among analysts, executives, and stakeholders better.
Types of Quantitative Data Analysis
Different analytical approaches answer different business questions.
| Analysis Type | Purpose |
| Univariate analysis | Analysis of one variable |
| Bivariate analysis | Study of relationship of two variables |
| Multivariate analysis | Analysis of multiple variables at once |
Selecting the appropriate analysis depends on research objectives and dataset complexity.
Statistical Software Used in Quantitative Data Analysis
Professionals use complex statistical packages to make their work accurate and efficient.
Examples are:
- Analysis using SPSS
- Programming in R
- SAS
- Python
- STATA
- Microsoft Excel
- Power BI
- Tableau
Out of all these packages, SPSS analysis is still one of the most popular options for business research, survey analysis, and research.
It has easy-to-use user interface along with advanced statistical features.
Common Challenges in Quantitative Data Analysis
The organization may come across several barriers when analyzing the information.
- Quality of data
- Sample size
- Missing values
- Choosing wrong statistical test
- Misinterpretation of the findings
- Biased data
- Lack of expertise in statistics [4]
Collaborating with professional statisticians will be helpful in overcoming the above-mentioned barriers.
Best Practices for Accurate Quantitative Data Analysis
To ensure the quality of research:
- Define research objectives clearly.
- Conduct proper sampling procedures.
- Determine sample sizes accurately.
- Perform proper data cleaning and validation.
- Self-check the choice of statistical procedures.
- Conduct self-check of statistical significance.
- Use visual dashboards for reporting.
- State assumptions and limitations.
Such an approach will increase the quality of both research and business decision-making.
Conclusion
The structured approach for quantitative data analysis helps firms convert raw numeric data into actionable business intelligence information. The process is completed by taking the seven key steps of setting up research objectives and preparation of data to use descriptive statistics, inferential statistics, hypothesis testing, correlation, regression analysis, ANOVA, and data visualization.
At Statswork, we provide end-to-end Quantitative Data Analysis Services tailored for businesses, researchers, healthcare organizations, and academic institutions. Our experts specialize in survey data analysis, SPSS analysis, regression modeling, hypothesis testing, multivariate analysis, and customized statistical reporting. Whether you need support with research methodology, business analytics, or large-scale data interpretation, Statswork delivers reliable, accurate, and actionable insights to help you achieve confident decision-making and measurable outcomes.
Frequently Asked Questions (FAQs)
The seven steps in the quantitative analysis approach include defining the research problem, collecting quantitative data, cleaning and preparing the dataset, performing descriptive statistics, applying inferential statistical methods, interpreting the results, and presenting the findings through reports and visualizations.
The steps of quantitative analysis involve identifying the research objective, gathering numerical data, organizing and cleaning the data, selecting appropriate statistical methods, analyzing the data, interpreting the results, and communicating the findings to support informed decision-making.
The seven steps of data analysis consist of defining the objective, collecting data, cleaning and preparing the dataset, exploring the data, conducting statistical analysis, interpreting the results, and presenting the findings using reports and visualizations.
The five steps of data analysis are defining the problem, collecting relevant data, preparing and cleaning the data, analyzing the information using suitable techniques, and interpreting and presenting the results for decision-making.
The five W’s of data analysis are Who, What, When, Where, and Why, which help researchers identify who the data represents, what information is being analyzed, when and where it was collected, and why the analysis is being conducted to achieve the research objectives.
The five main types of data analysis are descriptive analysis, which summarizes data; diagnostic analysis, which explains why events occurred; predictive analysis, which forecasts future outcomes; prescriptive analysis, which recommends actions; and inferential analysis, which draws conclusions about a larger population from sample data.
The six phases of data analysis include defining the research question, collecting data, cleaning and preparing the dataset, analyzing the data using statistical techniques, interpreting the findings, and reporting the results to support business or research decisions.
References:
- https://link.springer.com/chapter/ Njeri Mugwe, J., & Runo, S. (2026). Quantitative Data Analysis I: Key Steps and Descriptive Data Analysis. In Research Methodology in Agricultural Sciences(pp. 473-498). Singapore: Springer Nature Singapore.
- https://link.springer.com/chapte Njeri Mugwe, J., & Runo, S. (2026). Quantitative data analysis II (inferential analysis). In Research methodology in agricultural sciences(pp. 499-526). Singapore: Springer Nature Singapore.
- https://onlinelibrary.wiley.com/doi Sharifnia, A. M., Kpormegbey, D. E., Thapa, D. K., & Cleary, M. (2026). A primer of data cleaning in quantitative research: Handling missing values and outliers. Journal of advanced nursing, 82(1), 970-975.
- https://peerj.com/articles/20897/ Dwivedi, A. K. (2026). Step-by-step guide and checklists for selecting and conducting an evidence synthesis study using a framework for approaches and methods in evidence synthesis (FRAMES). PeerJ, 14, e20897.