

Give a compressive guide to quantitative Market Research. And explain the methodology for creating a successful quantitative market research survey?
October 29, 2020
Mention the steps involved in analyzing Interview transcripts in Qualitative research
November 9, 2020What are the characteristics of quantitative data? Explain how quantitative data analysis and interpretation takes place.
Meta Analysis Service
Recommended Reads
Contact us
Fast Facts:
Quantitative data analysis refers to the act of transforming numeric data into useful insights through measures like descriptive and inferential statistics. In business decision-making, it involves descriptive statistics like mean, median, mode, standard deviation and inferential statistics such as hypothesis testing, regression analysis, ANOVA and correlation analysis to facilitate KPI analysis, report preparation and data analysis. Such tasks are generally done by companies through platforms like SPSS, R, Python, SAS, Stata, Excel or Power BI; many choose to outsource them to a data analysis consultant.Introduction
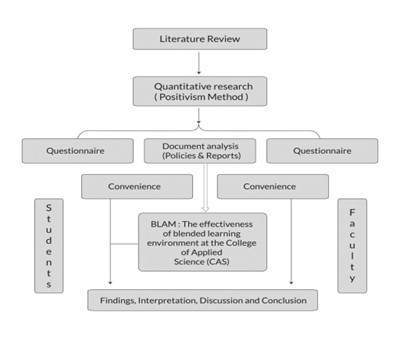
No matter whether a firm decides to price its products, enters the market or develops new items, each such decision will be more effective if based on numbers instead of intuition. This is what the essence of using quantitative data analysis for the sake of making business decisions is all about: turning raw numbers into structured and testable data [1]. Any data that is represented by any numbers – revenue, time, temperature, costs, distance – is quantitative data. And because it is structured data per se, it allows for conducting quantitative research.
This guide provides an overview of what quantitative data is, how it can be analyzed and interpreted, and what tools and approaches are used for transforming numbers into business decisions.
What Is Quantitative Data?
Quantitative Data refers to numeric data which is gathered using structured tools like surveys, polls, transactional databases, and sensor readings and analyzed using mathematical and statistical techniques. Quantitative data addresses questions of “how much,” “how many,” and “how often” and is the core of business intelligence and performance reporting [2].
Types of Quantitative Data are two categories of numeric data:
- Discrete Data – countable, limited numeric data (customers count, number of sales)
- Continuous Data – measurable numeric data which includes fractional numbers (revenue, weight, time)
Continuous data can be classified into two types, namely Interval Scale Data (equal intervals but no real zero, e.g., temperature) and Ratio Scale Data (equal intervals with real zero, e.g., price, age) .
Characteristics of Quantitative Data
The properties of quantitative data listed below should be understood before selecting the appropriate method of analysis:
- numeric nature – every number possesses an attribute which can be expressed numerically, not verbally like in the case of qualitative data.
- order – the values can be logically ordered ascending or descending.
- arithmetic properties – the values can be used in the arithmetic operations which serve as a foundation for almost all statistical methods.
- scaled property – there is a standardization of the measurement interval that allows us to make a fair comparison between the data values.
- collection process – collected with the help of surveys or polls on Likert scale, either being primary or secondary data [2].
- visualization – usually visualized by means of scatter plots and histograms.
Quantitative Data Analysis Methods
Quantitative data that has been gathered is analyzed through two types of statistical techniques.
Descriptive statistics simply state the information that the data presents: the meaning, median, mode, standard deviation, and frequency distribution. These are figures that describe the present situation of the metric being measured, which could be the average transaction size, customer lifetime, and so on.
On the other hand, inferential statistics involve the analysis of a sample to conclude about the whole population [3]. The following are some quantitative data analysis techniques used here:
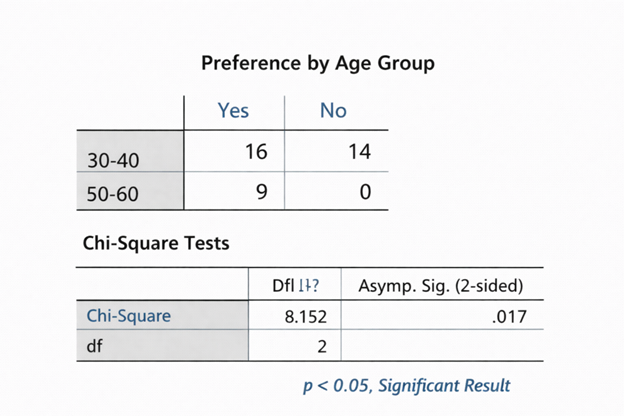
- Hypothesis Testing – checking if the results obtained are statistically significant or just by chance, assessed using the p value and the confidence interval
- Regression Analysis – analyzing relationships between variables for predicting certain outcomes (for example, relationship between budget for marketing campaigns and income generated)
- ANOVA – analyzing mean differences between three or more groups, helpful when conducting tests on multiple campaigns and/or regions simultaneously
- Correlation Analysis – assessing the degree of connection and direction between two variables
- Factor Analysis – condensing several variables into a few underlying factors, popular in surveys’ data analysis
- Time Series Analysis – analyzing variables over time to identify trends and seasonality, essential in demand and income forecasting
Properly applied, these techniques constitute evidence-based business strategy as opposed to speculation [3].

How to Interpret Quantitative Data: Step-by-Step
It is just as important to know how to analyze the data than how to conduct the test itself. There are four major steps involved in doing this:
- Validation of the data to ensure that the data was unbiasedly collected from the appropriate respondents.
- Data editing to verify its integrity, fixing any missing and erroneous entries.
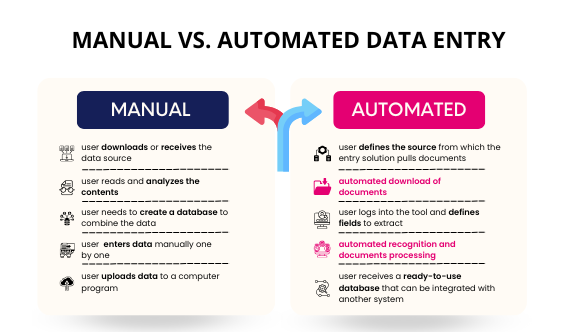
- Coding and data entry so that the collected data can be analyzed using statistical programs.
- Data transformation to adjust and manipulate the data for easier analysis; for example, reducing the five categories of a Likert scale into three categories through data normalization [4].
It is only at this point that the data can go on to being described or tested. Not validating the data is the biggest mistake made in preparing executive reports.
Tools for Quantitative Analysis
Most companies use various statistical packages depending on the task at hand.
- Statistical Package for Social Sciences (SPSS) – robust statistical package suitable for Chi-square test, t-test, ANOVA and factor analysis
- R statistical analysis – statistical analysis software, highly favored for modeling and visualization through programming codes among data scientists.
- Python Data Analysis – flexible scripting software that incorporates machine learning and handles huge amounts of data
- SAS analytics – enterprise class software for advanced reporting, forecasting and performance management
- Microsoft Excel – formula-based statistical analysis software
- Stata – popular software in economic research
- NVivo quantitative capabilities – helpful when using mixed methods research where numerical and qualitative data need to be coded together
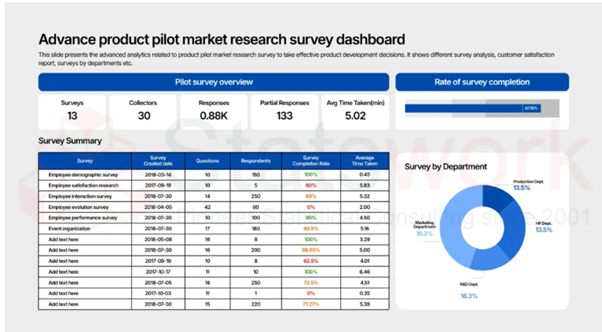
- Power BI Reporting and Tableau Data Visualization – used for transforming statistical analysis into dashboards for reporting to executives.
Why Businesses Outsource Quantitative Analysis
Quantitative analysis outsourcing initiatives need statisticians that are well-versed not only in methodology but also in business. When you have a B2B data analysis consultant partner, you get:
- Quick turnaround when it comes to analyzing market research and measuring KPIs
- Methodological approach in terms of corporate research methodology, proper choice of testing and samples
- Proper measurement of ROI in relation to your data analysis strategy
- Dashboard-ready reports that allow for decision-making based on data [4]
If your company does not have statisticians, then by outsourcing you are turning numbers into insights without recruiting an entire data analysis department.
Conclusion
Numbers still provide the best data that is analyzable and usable for strategy implementation because quantitative data is measurable and statistically verifiable. Descriptive statistics, regressions, and hypothesis testing are only some of the analytical techniques that when used correctly can transform raw figures into useful performance indicators of a company’s performance. It does not matter whether an organization analyzes its data using SPSS, R, or Python in its own offices or sends its data to a business-to-business data analysis consultant – the point is the same.
Through our Quantitative Data Analysis services, Statswork helps companies and individuals transform their data into management-relevant information using descriptive statistics, inferential statistics, testing of hypotheses, regression analysis, ANOVA, and survey data analysis. If you are an organization that needs professional assistance with data analysis on a consistent basis but does not want to form its own statistics team, then our Statistical Data Analysis services along with Corporate Statistics Consulting can serve the purpose.
Frequently Asked Questions (FAQs)
Quantitative data interpretation is the process of analyzing numerical data using statistical techniques to identify patterns, trends, relationships, and meaningful insights that support informed decision-making.
The four types of quantitative data are discrete data, continuous data, interval data, and ratio data, each differing in how numerical values are measured and analyzed.
The quantitative analysis approach involves defining the research problem, developing objectives or hypotheses, collecting data, preparing and cleaning data, conducting statistical analysis, interpreting results, and presenting findings.
The four main types of data analysis are descriptive analysis, diagnostic analysis, predictive analysis, and prescriptive analysis, which help organizations understand past performance, identify causes, forecast outcomes, and guide decision-making.
Examples of quantitative data include age, height, weight, income, sales revenue, test scores, temperature, distance travel, number of employees, and number of products sold, as they can all be measured numerically.
The four types of data interpretation are quantitative interpretation, qualitative interpretation, comparative interpretation, and predictive interpretation, each providing unique insights for understanding and utilizing data effectively.
References:
- Kotronoulas, G., Miguel, S., Dowling, M., Fernández-Ortega, P., Colomer-Lahiguera, S., Bağçivan, G., … & Papadopoulou, C. (2023, April). An overview of the fundamentals of data management, analysis, and interpretation in quantitative research. In Seminars in oncology nursing(Vol. 39, No. 2, p. 151398). WB Saunders. https://www.sciencedirect.com/science/article/pii/S0749208123000293
- Lim, W. M. (2025). What is quantitative research? An overview and guidelines. Australasian Marketing Journal, 33(3), 325-348. https://journals.sagepub.com/doi/full/10.1177/14413582241264622
- Pyo, J., Lee, W., Choi, E. Y., Jang, S. G., & Ock, M. (2023). Qualitative research in healthcare: necessity and characteristics. Journal of preventive medicine and public health, 56(1), 12. https://pmc.ncbi.nlm.nih.gov/articles/PMC9925284/
- Barroga, E., Matanguihan, G. J., Furuta, A., Arima, M., Tsuchiya, S., Kawahara, C., … & Izumi, M. (2023). Conducting and writing quantitative and qualitative research. Journal of Korean medical science, 38(37). https://synapse.koreamed.org/articles/1516083855
- Xiong, X. (2022, July). Critical review of quantitative and qualitative research. In 2022 3rd International conference on mental health, education and human development (MHEHD 2022)(pp. 956-959). Atlantis Press. https://www.atlantis-press.com/proceedings/mhehd-22/125975791
Contact us

Related posts


