
- Services
- Data Analysis services
- Sample Work
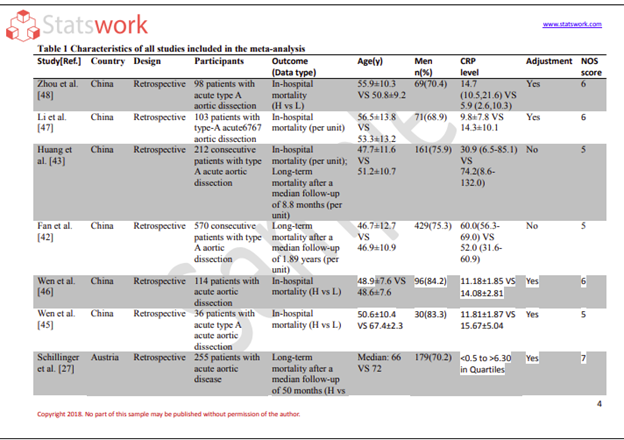
Data Analysis services
- Secondary Qualitative Research Services
- Secondary Quantitative Research Services
- Meta-Analysis Research services
- Sample Work
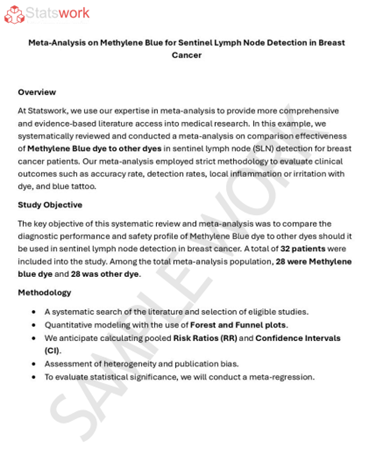
Meta-Analysis Research Services
- Data Collection Services
- Sample Work
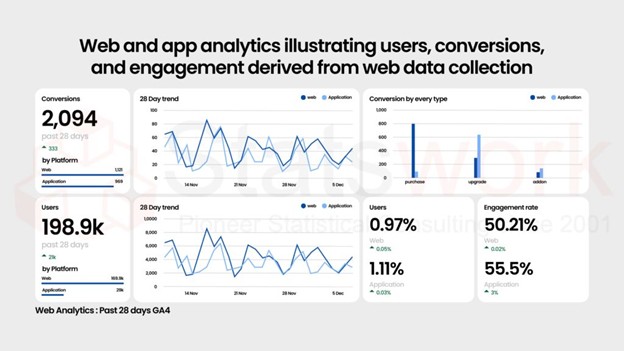
Data Collection Services
- Statistical & Biostatistics services
- Sample Work
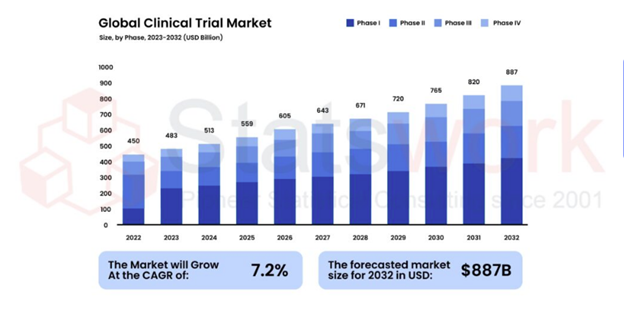
Statistical Programming & Biostatistics services
- Data Management Services
- Sample Work
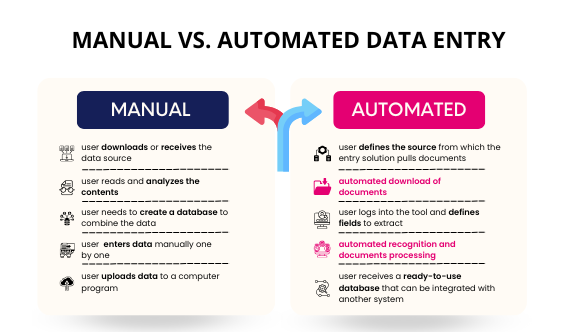
Data Management Services
- Research methodology services
- Sample Work
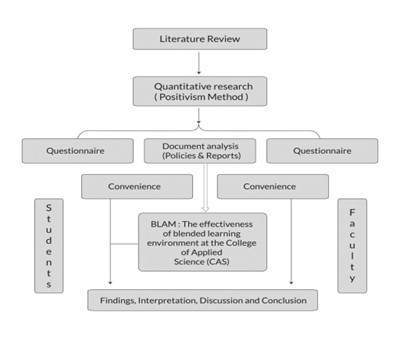
Research methodology services
- Tool Development Services
- Sample Work
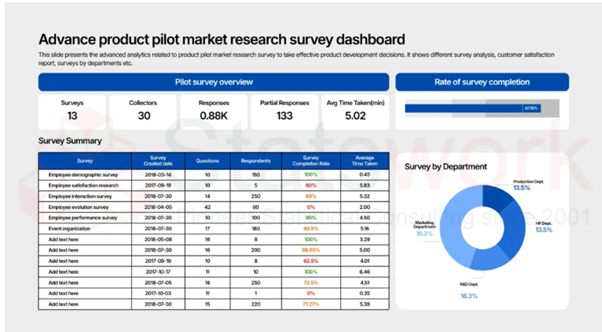
Tool development services
- Statistical Interpretation services
-
Statistical Interpretation services
- Sample Work
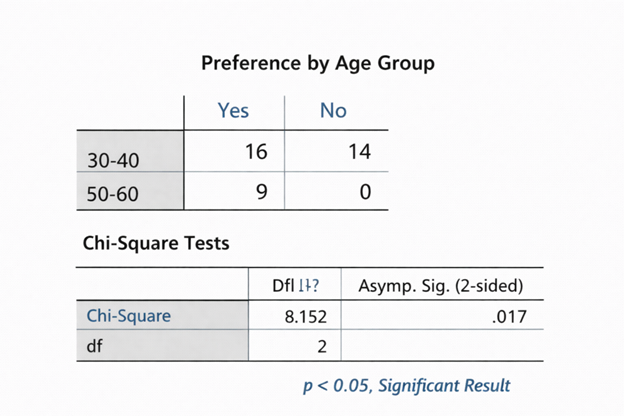
Statistical Interpretation services
-
- Sample Size Calculation Services
-
Sample Size Calculation Services
- Sample Work
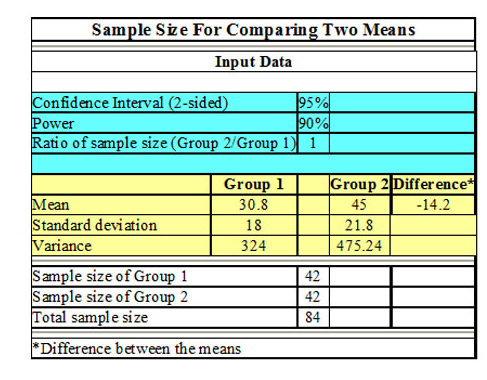
Sample Size Calculation Services
-
- AI & ML Services
-
Artificial Intelligence and Machine Learning Services
- Sample Work
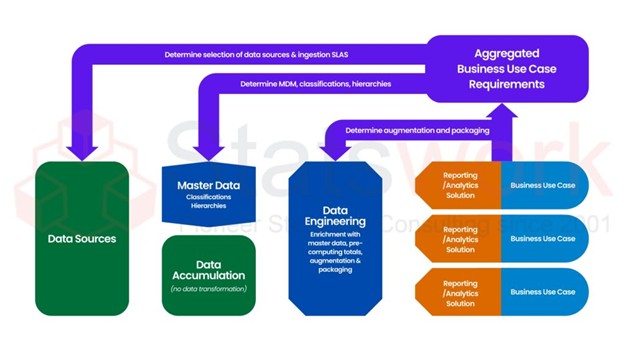
Artificial Intelligence and Machine Learning Services
-
- Meaningful Visualization Services
- Thought Leadership Services
- Report Generation Services
-
Report generation Service
- Sample Work
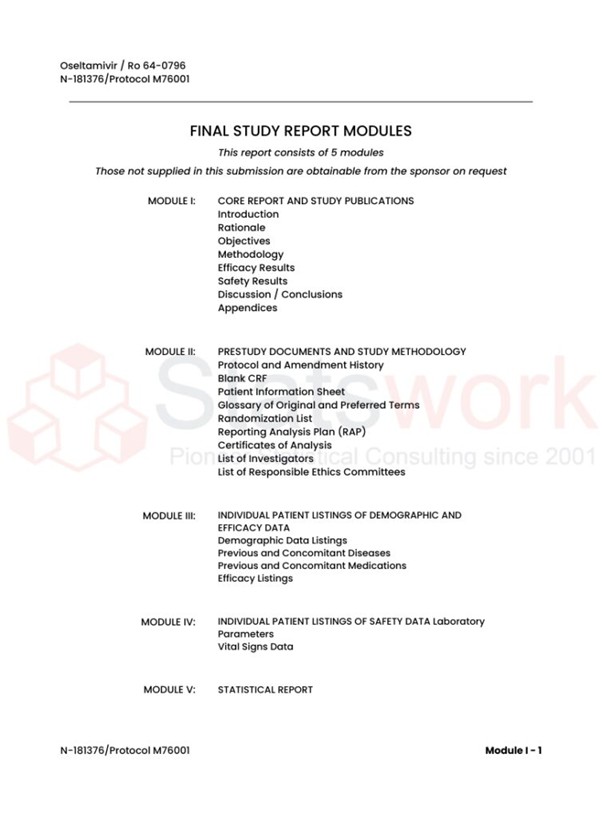
Report generation Services
-
- Data Analysis services
- Industries
- About Us
- Blog
- Insights
- Contact Us
- Services
- Data Analysis services
- Sample Work
Data Analysis services
- Secondary Qualitative Research Services
- Secondary Quantitative Research Services
- Meta-Analysis Research services
- Sample Work
Meta-Analysis Research Services
- Data Collection Services
- Sample Work
Data Collection Services
- Statistical & Biostatistics services
- Sample Work
Statistical Programming & Biostatistics services
- Data Management Services
- Sample Work
Data Management Services
- Research methodology services
- Sample Work
Research methodology services
- Tool Development Services
- Sample Work
Tool development services
- Statistical Interpretation services
-
Statistical Interpretation services
- Sample Work
Statistical Interpretation services
-
- Sample Size Calculation Services
-
Sample Size Calculation Services
- Sample Work
Sample Size Calculation Services
-
- AI & ML Services
-
Artificial Intelligence and Machine Learning Services
- Sample Work
Artificial Intelligence and Machine Learning Services
-
- Meaningful Visualization Services
- Thought Leadership Services
- Report Generation Services
-
Report generation Service
- Sample Work
Report generation Services
-
- Data Analysis services
- Industries
- About Us
- Blog
- Insights
- Contact Us
Common Mistakes in Data Analysis and How Experts Avoid Them
Meta Analysis Service
Recommended Reads
Contact us
Summary:
The present blog focuses on the most prevalent mistakes made during data analysis in respect to B2B decision-making, which include bad data integrity, lack of data, wrong statistics, overfitting, error in correlation, and confirmation bias. The article also gives insight into the solution, necessary data quality measures, and analytical tools.
In the context of B2B businesses, decision-making based on data is as good as the data it relies on. Even a small mistake within one of your datasets could silently influence forecasting, board reports, and your go-to-market approach – causing real monetary losses for your business rather than just inaccurate research. Here is the list of typical data analysis mistakes faced by corporate employees and how to prevent them from harming the quality of research.
Why Data Analysis Mistakes Are Harmful to Business
When a SaaS company misinterprets churn data and ends up spending less money on retaining its customers or when a retailer misinterprets seasonality because of bad data validation, the consequence goes beyond research. Typical consequences are as follows:
- Misinforming executives
- Bad market entry or pricing strategy
- Legal exposure
- Loss of trust of stakeholders in analytics team
Common Data Analysis Mistakes in Business Decision Making
| Mistake | What Goes Wrong | Business Impact |
| Poor data integrity | Duplicate, incomplete, or mismatched records | Skewed KPIs and dashboards |
| Ignoring missing data | Nulls dropped without review | Biased customer or sales insights |
| Wrong statistical methods | Mismatched test for the data type | Invalid, unusable conclusions |
| Overfitting models | Model tuned too tightly to historical data | Forecasts fail on new data |
| Correlation vs causation errors | Assuming one metric causes another | Misdirected strategy |
| Confirmation bias | Cherry-picking results that fit assumptions | Blind spots in strategic planning |

Closer Examination: Errors in Analyzing Quantitative Data
1. Data Validation and Data Integrity Flaw One:
In a manufacturing company, merging sales reports from different regions with varying date formats may affect the comparison on a quarterly basis. Solution: Professionals correct this through automation and cross-verification of multiple data sources prior to analyzing.
2. Handling Missing Data and Outliers:
The deletion of survey responses due to incompleteness without looking into the reason behind their absence may cause an error in the overall study. Solution: Survey responses are subjected to imputation and outlier detection first before excluding any from the analysis.
3. Statistical Errors due to Inappropriate Test:
The use of parametric test for sales data which doesn’t normally follow any distribution causes statistical errors. Solution: Validating assumptions and choosing appropriate test based on data distribution prevents such errors.
4. Over-Fitting Models:
A forecasting model that fits perfectly with last year’s data yet fails to fit this quarter is a classic case of over-fitting.
5. Mistaking Correlation for Causation:
The increase in marketing budget and sales could be linked by seasonality. Domain knowledge will prevent such expensive mistakes.
6. Confirmation Bias:
The analyst unknowingly tends to look for information that validates his leader’s existing beliefs. Blind analysis and peer reviews are essential to quantitative research methodologies.
Evidence-Based Solutions: Simple Checklist
- Data Quality Management: Clean, standardized and de-duplicated prior to analysis
- Significance: Test assumptions, not only p-values
- Cross-validation: Divide data to prove generalizability of the model
- Outlier Analysis: Investigate and don’t delete without analysis
- Peer Review: Invite one more analyst to interpret the results
- Document: Describe the methodology for audit-proof research accuracy
Who Will Be Interested in This?
- Financial officers and teams who use forecasting models
- Market research and business intelligence teams
- Product teams who analyze adoption features
- Any organization that outsources data analysis for research accuracy
Tools That Reduce Corporate Data Analysis Errors
| Tool Category | Examples | Purpose |
| Statistical software | R, SPSS, SAS | Accurate hypothesis testing |
| Visualization | Tableau, Power BI | Spot anomalies early |
| Data cleaning | Python, OpenRefine | Fix data integrity issues |
| Validation | Excel rules, custom scripts | Catch errors pre-analysis |
Conclusion
Mistakes that occur during the analysis of data in the business environment are not grandiose; rather, they are small mistakes made while validating, choosing methods, or interpreting the data. High levels of data quality management are needed to rectify these issues.
Statswork Data Analysis Services help B2B teams close exactly these gaps — from data validation and quantitative research methodology to statistical reviews so your research holds up to scrutiny, and your decisions hold up in the market. Talk to our experts today.
Frequently Asked Questions (FAQs)
Common mistakes to avoid in data analysis include poor data quality, ignoring missing values, using inappropriate statistical methods, overfitting models, confusing correlation with causation, and allowing confirmation bias to influence results.
The 80/20 rule, also known as the Pareto Principle, states that approximately 80% of outcomes often result from 20% of causes, helping data scientists prioritize the most influential variables, customers, or processes.
The seven common pitfalls of statistics include poor data collection, sampling bias, small sample sizes, misleading data visualization, confusing correlation with causation, inappropriate statistical tests, and overgeneralizing results beyond the available data.
The five C’s of data science are Collection, Cleaning, Computation, Communication, and Collaboration, which together ensure accurate data analysis and effective decision-making.
The four pillars of data science are Mathematics and Statistics, Computer Science and Programming, Domain Knowledge, and Data Visualization and Communication, which collectively enable organizations to extract meaningful insights from data.
The five V’s of data are Volume, Velocity, Variety, Veracity, and Value, which describe the key characteristics of big data and help organizations manage and analyze data effectively.
References:
- Zeindler, J., Taha, A., Ponholzer, F., Ochs, V., Rakhmatillokhon, K., Soysal, S., … & Rosenberg, R. (2026). Understanding and applying statistical methods in surgical research: a comprehensive guide for clinicians. European Surgery, 1-13.https://link.springer.com/article
- Liang, C., Yang, D., Liang, Z., Liang, Z., Zhang, T., Xiao, B., … & Wang, H. (2026). Revisiting data analysis with Pre-trained foundation models: C. Liang et al. The VLDB Journal, 35(1), 10.https://link.springer.com/article
- Kobara, Y. M., Akpan, I. J., Nam, A. D., AlMukthar, F. H., & Peter, M. (2026). Artificial intelligence and data science methods for automatic detection of white blood cells in images. Journal of Imaging Informatics in Medicine, 39(1), 583-603.https://link.springer.com/
- Littlewood, K. E., & Gardner, D. H. (2026). A brief guide to qualitative research in veterinary science: interviews, focus groups, surveys and reflexive thematic analysis for practitioners and researchers. New Zealand Veterinary Journal, 1-11.https://www.tandfonline.com