
- Services
- Data Analysis services
- Sample Work
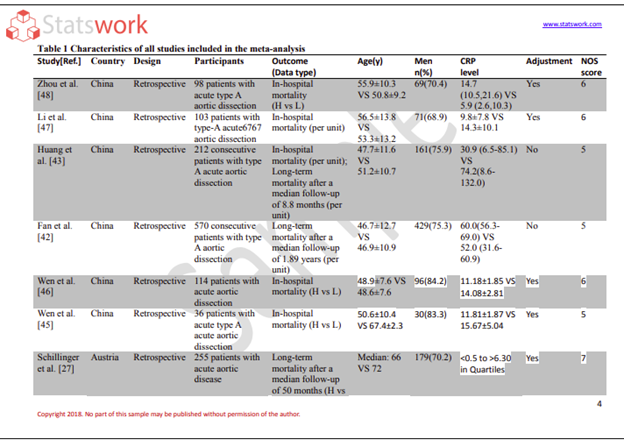
Data Analysis services
- Secondary Qualitative Research Services
- Secondary Quantitative Research Services
- Meta-Analysis Research services
- Sample Work

Meta-Analysis Research Services
- Data Collection Services
- Sample Work
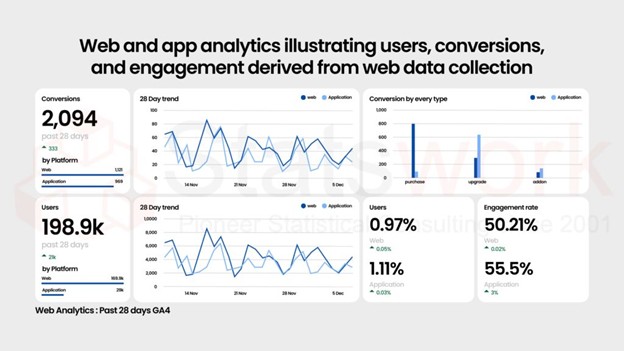
Data Collection Services
- Statistical & Biostatistics services
- Sample Work
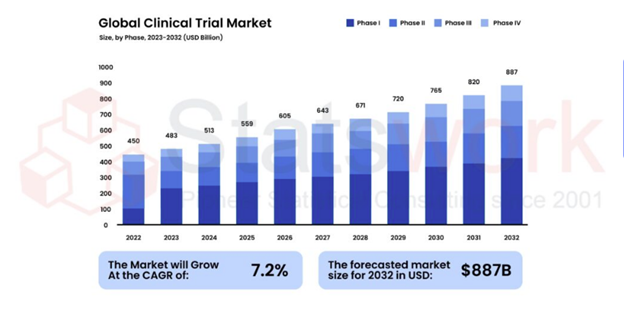
Statistical Programming & Biostatistics services
- Data Management Services
- Sample Work
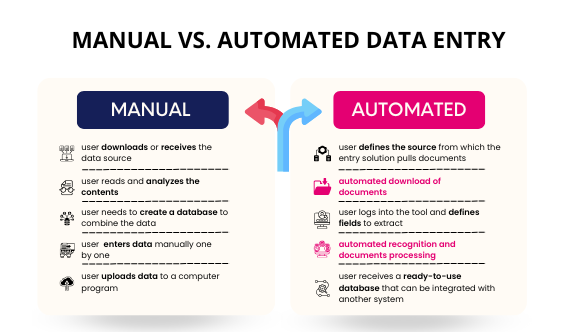
Data Management Services
- Research methodology services
- Sample Work
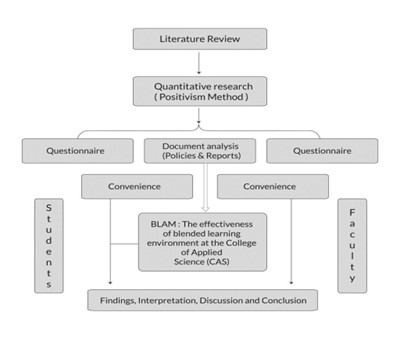
Research methodology services
- Tool Development Services
- Sample Work
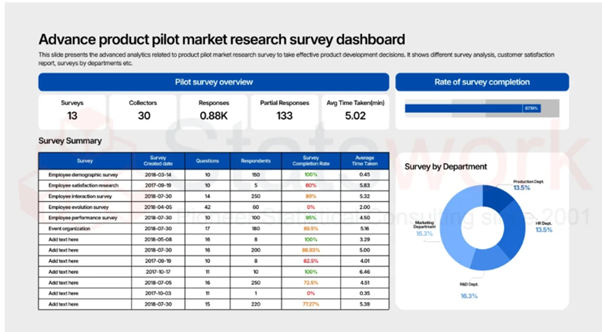
Tool development services
- Statistical Interpretation services
-
Statistical Interpretation services
- Sample Work
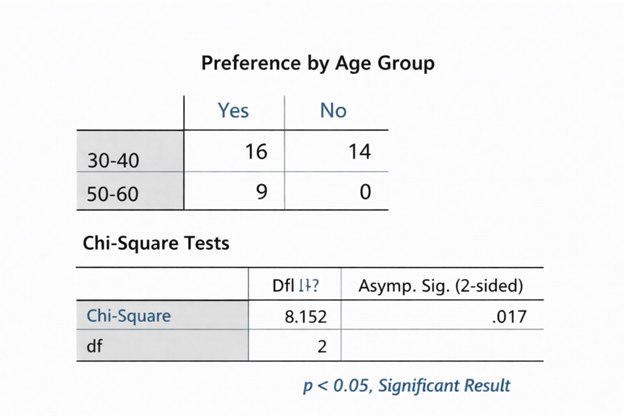
Statistical Interpretation services
-
- Sample Size Calculation Services
-
Sample Size Calculation Services
- Sample Work
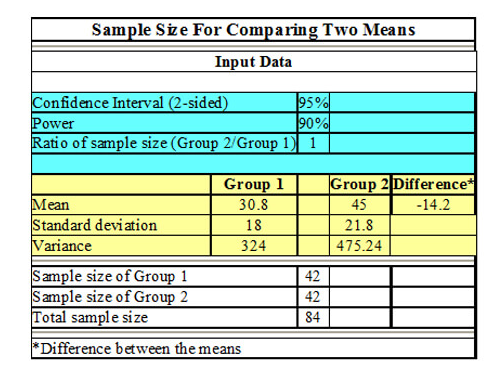
Sample Size Calculation Services
-
- AI & ML Services
-
Artificial Intelligence and Machine Learning Services
- Sample Work
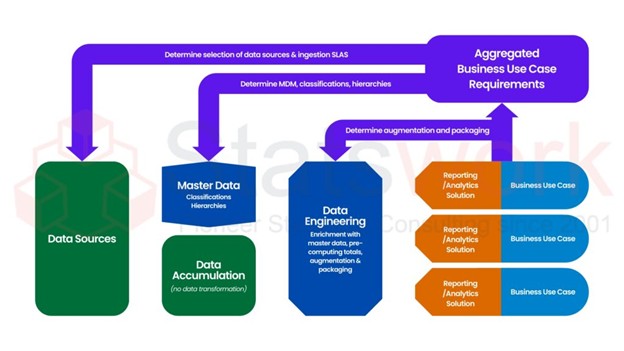
Artificial Intelligence and Machine Learning Services
-
- Meaningful Visualization Services
- Thought Leadership Services
- Report Generation Services
-
Report generation Service
- Sample Work

Report generation Services
-
- Data Analysis services
- Industries
- About Us
- Blog
- Insights
- Contact Us
- Services
- Data Analysis services
- Sample Work
Data Analysis services
- Secondary Qualitative Research Services
- Secondary Quantitative Research Services
- Meta-Analysis Research services
- Sample Work
Meta-Analysis Research Services
- Data Collection Services
- Sample Work
Data Collection Services
- Statistical & Biostatistics services
- Sample Work
Statistical Programming & Biostatistics services
- Data Management Services
- Sample Work
Data Management Services
- Research methodology services
- Sample Work
Research methodology services
- Tool Development Services
- Sample Work
Tool development services
- Statistical Interpretation services
-
Statistical Interpretation services
- Sample Work
Statistical Interpretation services
-
- Sample Size Calculation Services
-
Sample Size Calculation Services
- Sample Work
Sample Size Calculation Services
-
- AI & ML Services
-
Artificial Intelligence and Machine Learning Services
- Sample Work
Artificial Intelligence and Machine Learning Services
-
- Meaningful Visualization Services
- Thought Leadership Services
- Report Generation Services
-
Report generation Service
- Sample Work
Report generation Services
-
- Data Analysis services
- Industries
- About Us
- Blog
- Insights
- Contact Us
Single-Arm Trial, No Head-to-Head Data: Will IQWiG Accept Your Propensity-Score-Adjusted Comparison?
Statistical and Biostatistical Services
- Why a propensity score cannot recreate randomisation
- What IQWiG will scrutinise
- Start with the estimand, not the model
- Worked example: good balance, weak evidence
- What if a key confounder is poorly measured?
- Sensitivity analyses that test the conclusion
- The comparator dataset matters more than its size
- What to document before submission
- Conclusion
- FAQ
- Reference
Recommended Reads
Contact us
Key takeaway
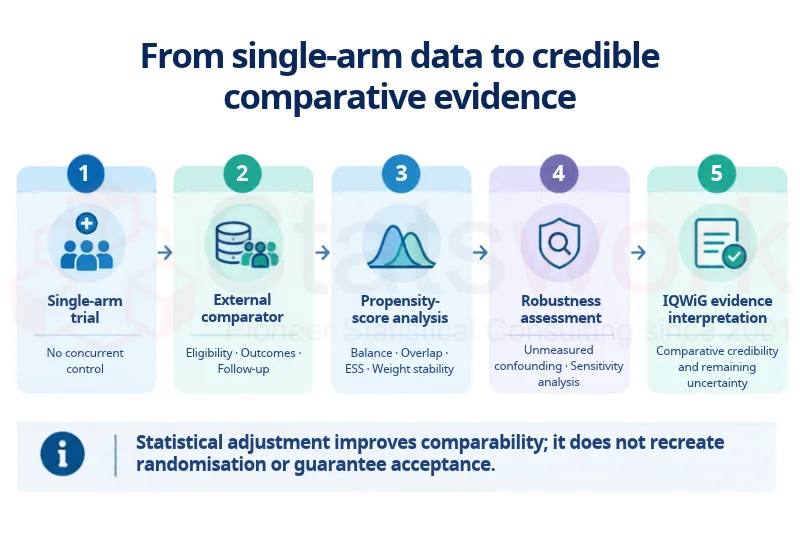
Propensity-score adjustment can make an external comparison fairer, but it does not decide its evidentiary value. IQWiG judges the whole chain: comparator suitability, confounder measurement, overlap, effect size and robustness to residual bias.
For sponsors entering AMNOG with only a single-arm trial, an external comparator looks like the obvious fix for a missing control arm. IQWiG assesses the dossier and the Federal Joint Committee (G-BA) decides on added benefit; both judge the full evidence chain, not the adjustment method. [1]
In April 2025, IQWiG and other European HTA bodies and regulators stated that post-hoc external comparisons built from observational real-world data, without adequate adjustment for confounding and other biases, generally do not provide robust estimates of relative treatment effects for HTA. [3] The real question is whether your comparison survives a methodologist trying to break it.
Why a propensity score cannot recreate randomisation
A propensity score, e(X) = P(A = 1 | X), is the probability that a patient receives the study treatment given measured baseline covariates X. Matching, stratification or inverse probability of treatment weighting (IPTW) on this score can balance those covariates between trial patients and external controls. [4]
Randomisation balances measured and unmeasured factors; a propensity score balances only what was recorded, as accurately as it was recorded. A causal interpretation still rests on consistency, conditional exchangeability, positivity and a correctly specified model. [4] Good balance supports the last assumption, not exchangeability. As IQWiG notes, improvement in a single group cannot be attributed to treatment without an appropriate comparison. [2]
What IQWiG will scrutinise
Evidence issue | Question reviewers ask | Bias if it fails |
Population | Can the external source reproduce trial eligibility? | Selection bias |
Confounding | Are key prognostic factors recorded, and recorded comparably? | Residual confounding |
Positivity | Do trial patients have comparable external counterparts? | Extrapolation, unstable weights |
Outcomes | Are endpoint definitions and ascertainment equivalent? | Information bias |
Time zero | Does follow-up start at an equivalent point? | Immortal-time bias |
Care context | Are supportive care and monitoring comparable? | Systematic outcome differences |
IQWiG publishes no propensity-score threshold for acceptance, but it sets a high bar for effect size. Its 2020 rapid report on routine practice data proposed that, for non-randomised comparisons, the confidence interval must clear a predefined threshold (for example, a relative risk of 2 to 5, depending on data quality), not merely exclude no effect. [7] For a beneficial effect on a ratio scale, that means an upper confidence limit below roughly 0.5, and lower still where data quality is weaker.
Start with the estimand, not the model
Define the target population, treatment contrast, endpoint, time zero and handling of intercurrent events before fitting any propensity model. In most single-arm settings, the relevant question is the effect in patients like those in the trial: the average treatment effect in the treated (ATT). Trial patients receive a weight of 1 and external controls e(X) / [1 − e(X)], so controls are reweighted to resemble the trial population. [4] ATE weights answer a different question.
Select confounders on clinical and causal grounds and prespecify them in the protocol and analysis plan, not by univariable p-values or database availability. [7]
Worked example: good balance, weak evidence
Consider 200 trial patients and 800 registry controls, analysed with ATT weights.
Diagnostic | Before weighting | After weighting |
Age, standardised mean difference (SMD) | 0.31 | 0.04 |
Disease severity (recorded), SMD | 0.42 | 0.07 |
External-control effective sample size (ESS) | 800 | 310 |
Trial patients without comparable controls | — | 15% |
Hazard ratio for death (95% CI) | 0.62 (0.51–0.75) | 0.76 (0.58–0.99) |
Illustrative values only. ESS = (Σw)² / Σw².
Every SMD is below the conventional 0.10 benchmark, yet three findings weaken the result. ESS has fallen 61%, so a few heavily weighted controls drive the estimate. Restricting to the 85% of trial patients with overlap changes the estimand. And although the upper limit of 0.99 puts p just below 0.05, the interval is nowhere near 0.5. Statistical significance here is not evidence of a large, bias-resistant benefit.
What if a key confounder is poorly measured?
Suppose disease severity drives both treatment selection and survival, but the registry records it more crudely than the trial. Adjusting for a confounder misclassified differently in the two sources can move the estimate further from the truth than no adjustment. [6]
The E-value is the minimum risk-ratio association an unmeasured confounder would need with both treatment and outcome to explain away the result. [8] For the adjusted HR of 0.76 (common-outcome approximation), it is about 1.7 for the point estimate and 1.09 for the confidence limit: a weak confounder could pull the interval across 1.00. Where feasible, validate the confounder in a subsample and correct for misclassification. [6]
Sensitivity analyses that test the conclusion
Prespecify analyses designed to overturn the result:
- alternative clinically justified covariate sets;
- matching versus weighting, and overlap restriction or weight truncation;
- multiple imputation under different missing-data assumptions;
- alternative outcome definitions, censoring rules and time zero; and
- bias analysis for unmeasured or misclassified confounding.
If the effect holds across them, credibility increases; if it swings, that instability is the finding. Our epidemiological biostatistics guide covers related design choices.
The comparator dataset matters more than its size
Differences in eligibility, outcome ascertainment, follow-up intensity, care setting and data quality are recognised sources of bias in external control groups. [5] A 5,000-patient registry that cannot reproduce trial eligibility may be weaker than a 300-patient external trial cohort with matching definitions. Source selection and data validation belong to the evidence strategy.
What to document before submission
Before the treatment effect is known, document the data-source rationale, eligibility mapping, estimand, confounder definitions, propensity model, balance, overlap and ESS diagnostics, missing-data handling and sensitivity analyses. A post-hoc analysis gains no evidentiary status simply because it uses a recognised causal-inference method. [3] The same applies to subgroup analyses in German benefit assessment.
How Statswork supports IQWiG-ready external comparisons When the comparator is the weakest link in your dossier, the key decisions (estimand, confounders, weighting, bias analysis) must be documented before results are seen. Statswork’s Statistical and Biostatistical Services team assesses external data sources against trial eligibility, prespecifies the propensity-score strategy in an SAP, runs balance, overlap and ESS diagnostics, and quantifies residual confounding with bias analysis. You receive a reproducible analysis package and a transparent report of what the data support and where uncertainty remains. Talk to a Statswork biostatistician about your single-arm evidence plan. |
Conclusion
Propensity-score adjustment improves measured comparability; it does not substitute for randomisation. Credibility with IQWiG comes from a suitable comparator, well-measured confounders, adequate overlap, a large, robust effect and transparent uncertainty.
Frequently Asked Questions (FAQs)
There is no guaranteed route. IQWiG weighs comparator suitability, confounder control, overlap, effect size and residual uncertainty together.
No. It balances measured covariates only; it cannot ensure exchangeability when key confounders are unmeasured or poorly measured.
Overlap, weight distributions, effective sample size, missing data and sensitivity to residual confounding.
Rarely. IQWiG has proposed that non-randomised effects must clear a threshold well beyond no effect, not simply exclude 1.
Yes. Prespecifying the data source, estimand, confounders and analyses improves transparency and limits post-hoc choices.
References:
[1] IQWiG. General Methods, Version 8.0. Cologne: IQWiG; 2025. iqwig.de/methoden/general-methods_version-8-0.pdf
[2] IQWiG. Why do we need comparative data for benefit assessments? iqwig.de/en/methods/evidence-based-medicine/why-a-comparison/
[3] IQWiG. Joint positions for better evidence in approval and benefit assessments (joint HTA body–regulator perspectives). 1 April 2025. iqwig.de/en/presse/iqwig-comments/1-april-2025.html
[4] Austin PC, Stuart EA. Moving towards best practice when using inverse probability of treatment weighting (IPTW) using the propensity score to estimate causal treatment effects in observational studies. Stat Med. 2015;34(28):3661–3679. doi:10.1002/sim.6607
[5] Seeger JD, Davis KJ, Iannacone MR, et al. Methods for external control groups for single arm trials or long-term uncontrolled extensions to randomized clinical trials. Pharmacoepidemiol Drug Saf. 2020;29(11):1382–1392. doi:10.1002/pds.5141
[6] Webster-Clark M, Jonsson Funk M, Stürmer T. Single-arm trials with external comparators and confounder misclassification: how adjustment can fail. Med Care. 2020;58(12):1116–1121. doi:10.1097/MLR.0000000000001400
[7] IQWiG. Concepts for the generationof routine practice data and their analysis for the benefit assessment of drugs according to §35a SGB V (Rapid Report A19-43, extract). 10 January 2020. iqwig.de/download/A19-43_Routine-practice-data-for-the-benefit-assessment-of-drugs_Extract-of-rapid-report_V1-0.pdf
[8] VanderWeele TJ, Ding P. Sensitivity analysis in observational research: introducing the E-value. Ann Intern Med. 2017;167(4):268–274. doi:10.7326/M16-2607