
- Services
- Data Analysis services
- Sample Work
Data Analysis services
- Secondary Qualitative Research Services
- Secondary Quantitative Research Services
- Meta-Analysis Research services
- Sample Work
Meta-Analysis Research Services
- Data Collection Services
- Sample Work
Data Collection Services
- Statistical & Biostatistics services
- Sample Work
Statistical Programming & Biostatistics services
- Data Management Services
- Sample Work
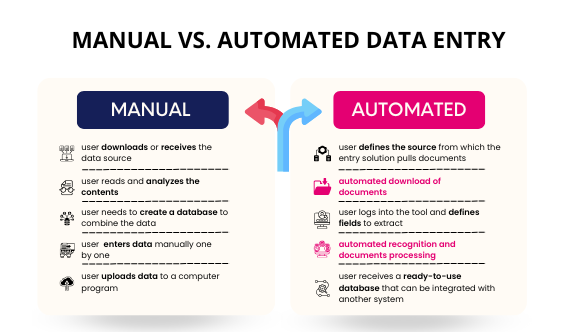
Data Management Services
- Research methodology services
- Sample Work
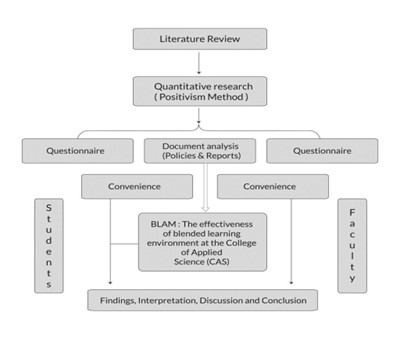
Research methodology services
- Tool Development Services
- Sample Work
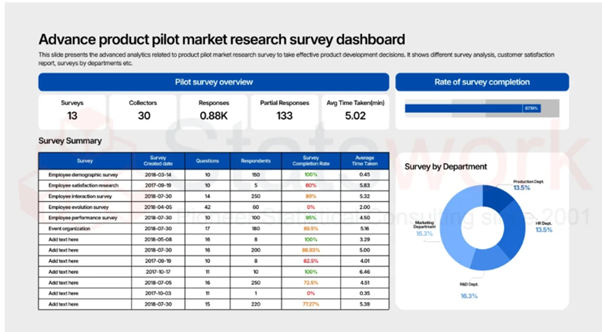
Tool development services
- Statistical Interpretation services
-
Statistical Interpretation services
- Sample Work
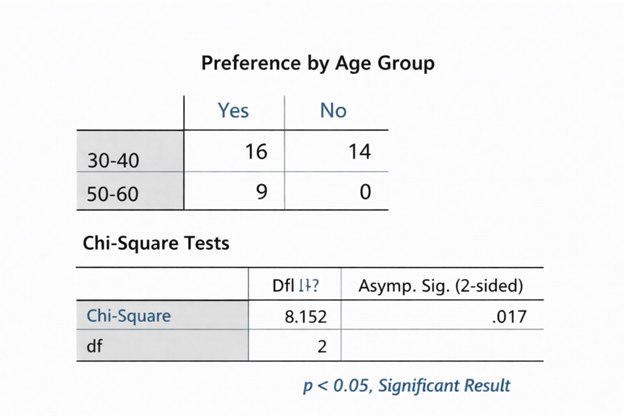
Statistical Interpretation services
-
- Sample Size Calculation Services
-
Sample Size Calculation Services
- Sample Work
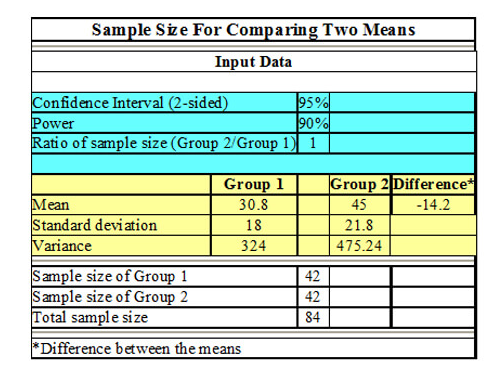
Sample Size Calculation Services
-
- AI & ML Services
-
Artificial Intelligence and Machine Learning Services
- Sample Work
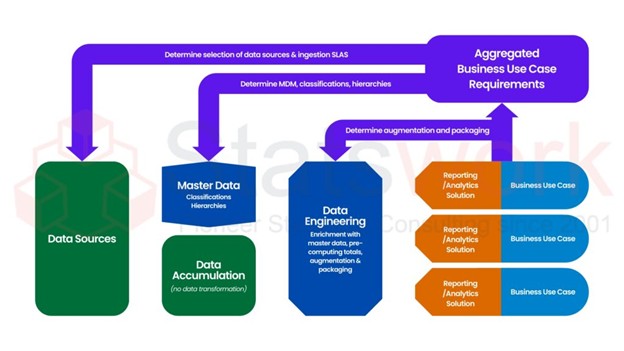
Artificial Intelligence and Machine Learning Services
-
- Meaningful Visualization Services
- Thought Leadership Services
- Report Generation Services
-
Report generation Service
- Sample Work
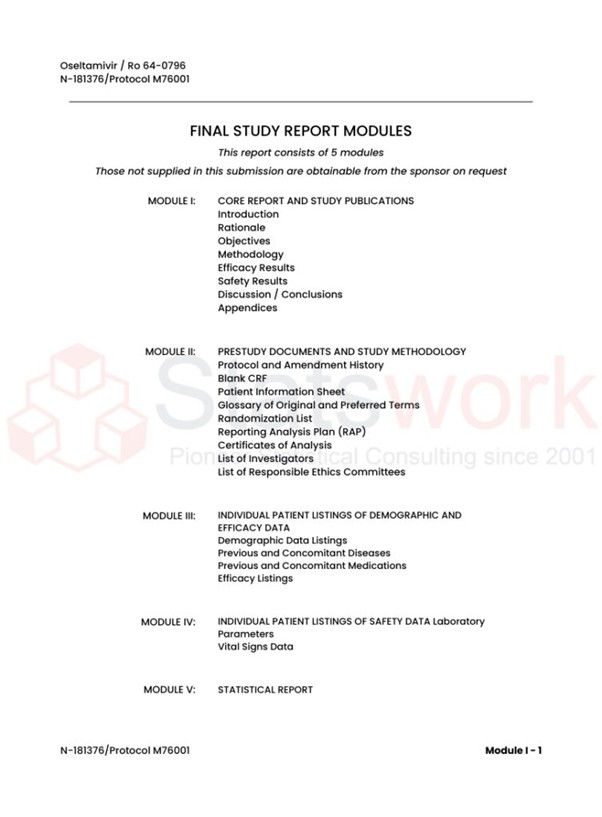
Report generation Services
-
- Data Analysis services
- Industries
- About Us
- Blog
- Insights
- Contact Us
- Services
- Data Analysis services
- Sample Work
Data Analysis services
- Secondary Qualitative Research Services
- Secondary Quantitative Research Services
- Meta-Analysis Research services
- Sample Work
Meta-Analysis Research Services
- Data Collection Services
- Sample Work
Data Collection Services
- Statistical & Biostatistics services
- Sample Work
Statistical Programming & Biostatistics services
- Data Management Services
- Sample Work
Data Management Services
- Research methodology services
- Sample Work
Research methodology services
- Tool Development Services
- Sample Work
Tool development services
- Statistical Interpretation services
-
Statistical Interpretation services
- Sample Work
Statistical Interpretation services
-
- Sample Size Calculation Services
-
Sample Size Calculation Services
- Sample Work
Sample Size Calculation Services
-
- AI & ML Services
-
Artificial Intelligence and Machine Learning Services
- Sample Work
Artificial Intelligence and Machine Learning Services
-
- Meaningful Visualization Services
- Thought Leadership Services
- Report Generation Services
-
Report generation Service
- Sample Work
Report generation Services
-
- Data Analysis services
- Industries
- About Us
- Blog
- Insights
- Contact Us
Can Environmental Monitoring Trends Predict Contamination Before It Happens Under Annex 1's Contamination Control Strategy?
Data Analysis Services
- What EU GMP Annex 1 Requires
- Trend Detection Versus Prediction
- Statistical Methods for Pharmaceutical Environmental Monitoring
- What Published Monitoring Studies Demonstrate
- How to Validate Predictive Environmental Monitoring
- Worked Example: A Warning Is Not Proof
- Integrate Warnings into the CCS
- Conclusion
- Frequently Asked Questions
- References
Recommended Reads
Contact us
Summary
Environmental monitoring trends can reveal early signs of deteriorating cleanroom control before formal limits are breached. This article examines statistical methods, published research and EU GMP Annex 1 expectations, explaining how pharmaceutical manufacturers can evaluate warning signals, control false alerts and validate predictive models without overstating their ability to forecast contamination
Environmental monitoring (EM) results can remain below alert and action limits while microbial recovery patterns change. Increasing positive-sample rates, recurring excursions or altered recovery frequency may indicate deteriorating environmental control before an individual result breaches a formal limit.
But detecting deterioration is not the same as predicting contamination. A statistical signal identifies unusual behaviour relative to a baseline. A predictive model must estimate a defined future outcome within a useful time horizon, with performance demonstrated on independent data. Manufacturers therefore need to establish whether EM trends provide reliable, actionable information—not simply whether trends exist.
What EU GMP Annex 1 requires
EU GMP Annex 1 integrates environmental monitoring into the Contamination Control Strategy (CCS). Sections 9.10–9.13 address monitoring, adverse trends and responses to alert-level and action-limit excursions. Section 9.11 identifies patterns requiring attention, including increasing excursions, consecutive alert-level excursions, recurring isolated action-limit excursions that may share a cause, and changes in microbial flora. [1]
These expectations support systematic trend review, investigation and appropriate responses; they do not prescribe predictive algorithms. An internal statistical warning generated by a trend-analysis method is distinct from an alert-level or action-limit excursion. Unless the approved procedure explicitly defines the statistical rule as part of the formal excursion criteria, the warning should be documented and assessed as an internal analytical signal rather than automatically classified as a regulatory excursion. Applicable alert and action limits, approved procedures and required investigation pathways remain controlling. Statistical warnings must supplement—not replace—formal excursion handling, root-cause investigation, corrective and preventive action, or product-impact assessment.
Trend detection versus prediction
Approach | What it establishes | What it cannot establish alone |
Trend analysis | Change from historical behaviour | That contamination will occur |
Statistical process control | A signal of unusual process behaviour | The probability of a specific future event |
Predictive modelling | Estimated risk of a defined future outcome | Reliable performance without validation |
Prospective validation | Performance under evaluated conditions | Guaranteed performance in every facility |
Control charts can identify shifts before formal limits are breached, but effectiveness depends on the method, assumptions, sampling frequency and data quality. A signal warrants assessment; it does not automatically prove increased contamination risk.
Statistical methods for pharmaceutical environmental monitoring
Choose a method according to the outcome and sampling design. For positive samples out of a known total, binomial regression or a suitable proportion chart can assess whether the recovery probability changes. The denominator matters: a rise in positives means something different when the number of samples has changed. If results cluster by location, shift or sampling session, account for that dependence where necessary.
For CFU counts per sample, Poisson models may suit data whose mean–variance relationship fits their assumptions; negative binomial models can accommodate overdispersion. Excess zeros do not automatically justify a zero-inflated model: use one only when the data-generating process and diagnostics support it. Yang and colleagues examined zero-inflated modelling for setting alert and action limits, not forecasting future contamination. [5]
For intervals between positive recoveries, time-to-event or inter-arrival-time methods can assess whether recoveries are becoming more frequent. They must reflect discrete sampling opportunities and censoring rather than imply continuous observation. Control charts, including EWMA or CUSUM, may help detect gradual or sustained shifts when their assumptions and false-alarm behaviour are appropriate. Excursion-rate methods address a different question: whether formal-limit excursions are becoming more frequent.
Control-chart signals and formal excursions answer different questions. A statistical warning indicates that observed data may have departed from the established baseline; an alert-level or action-limit excursion is determined by the applicable limits and approved procedures. A statistical warning can occur while all individual results remain below formal limits. Conversely, a formal excursion must be managed under the applicable procedure even if the statistical method does not flag it. Record these outcomes separately in the analysis and define any escalation rules in advance.
Sampling changes can invalidate simple comparisons. Sample volume, sampled area, method, location, incubation conditions and frequency affect detection opportunities. Document changes, stratify unlike locations or methods where appropriate, and revise the baseline when comparability cannot be defended. A higher positive rate after more intensive sampling may reflect greater detection, not poorer control.
Existing literature has discussed the application of chart-based techniques in analysing microbial monitoring data, statistical techniques for identifying excursion trends, and frequency-based methods for monitoring-data analysis. [2–4] They help in choosing an appropriate technique, but they do not indicate a preferred model.
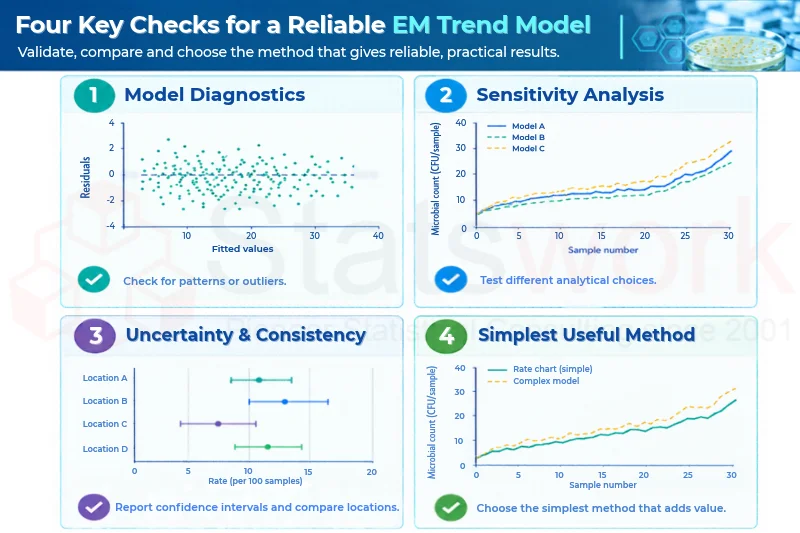
Avoid selecting thresholds solely because they perform well on the same historical data used to develop the method.
What published monitoring studies demonstrate
Gurijala and Barnett evaluated 24 statistical rules for detecting adverse trends in cleanroom microbiological monitoring data, including their false-alarm behaviour. [3] Tanna et al. analysed nearly ten years of monitoring data from a cGMP cleanroom facility manufacturing cellular therapy products. [6] Cundell et al. examined how sampling time relates to microbial counts and alert frequency during aseptic filling. [7]
These studies support structured environmental monitoring trend analysis, but do not independently establish reliable prediction of future contamination. Predictive claims require a defined outcome, a useful warning horizon and independent model validation.
How to validate predictive environmental monitoring
1. Define the outcome and warning horizon
Specify the event before developing a model: a subsequent alert-level excursion, action-limit excursion, predefined deterioration in environmental control or confirmed contamination. These endpoints are not interchangeable. Define how far ahead a warning must occur to allow meaningful investigation or intervention.
2. Establish a suitable baseline
Assess data completeness, sampling methods, locations, incubation conditions and operational context. Distinguish missing observations from genuine zero recoveries. Review changes in cleaning, maintenance, equipment, personnel activity or sampling procedures that may affect comparability. Facility-wide averages can conceal deterioration at an individual location.
3. Measure detection and false-alert performance
Evaluate sensitivity, positive predictive value, missed events, false-alert burden and lead time against predefined outcomes. Sensitivity measures the proportion of relevant events detected; positive predictive value measures the proportion of warnings followed by the defined event. When events are rare, many warnings may not be followed by the outcome. Precision-recall analysis can help assess this issue.
Set acceptance criteria before evaluation, reflecting the consequences of missed events, investigation capacity and minimum useful lead time. Compare the model with an appropriate existing monitoring approach and report uncertainty, especially when few events are available. The cited studies do not establish universal performance thresholds for predictive EM.
4. Validate independently
Separate model development from evaluation. Where feasible, test performance on later data not used to select variables or thresholds, then consider prospective evaluation under routine conditions. Prevent data leakage by including only information available when a warning would have been issued. If independent validation is absent, describe the method as exploratory trend analysis rather than a validated predictor. [8]
Worked example: a warning is not proof
Consider a hypothetical Grade B location where results rise from a historical pattern of mostly zero or one CFU per sample to 2, 3, 2, 4, 3, 4, 3 and 5 CFU per sample. Assume all remain below the applicable alert level.
A predefined rule flags the sequence. Before interpreting the signal as possible deterioration, the team verifies that the sampling locations, sample types, sampling frequency, recovery methods and operating conditions are comparable with the historical baseline. It then examines information from cleaning, maintenance, personnel activities, and adjacent monitoring to provide possible reasons for this observed pattern. Suppose an investigation identifies a cleaning weakness, and subsequent counts move towards baseline after corrective action. The internal statistical warning has prompted a potentially useful investigation, although it is not automatically an alert-level or action-limit excursion. The subsequent improvement is consistent with better environmental control but does not prove that the cleaning weakness caused the entire trend, that the intervention alone produced the improvement, or that the rule reliably predicts contamination. Any formal excursion must still be handled according to the applicable limits and approved procedure.
Integrate warnings into the CCS
Interpret statistical findings alongside particle monitoring, pressure differentials, cleaning and maintenance records, production activity and microbial identification. Associations can guide investigation but do not establish causation.
The CCS and associated procedures should define who reviews internal statistical warnings, the criteria for escalation, and documentation requirements. Record and assess these warnings separately from formal alert-level and action-limit excursions; a statistical signal must not change approved excursion criteria or replace required investigations and product-impact assessments.
Annex 1 highlights change in microbial flora, including spore-formers and moulds, that warrant attention [1]. Assess these findings in context rather than reducing them to a single score. Internal warnings must never delay formal excursion handling or product-impact assessment.
How Statswork supports environmental monitoring trend analysis
The objective is to determine whether an approach provides actionable evidence of deteriorating environmental control rather than simply generating more alerts. Statswork’s Data Analysis service can help pharmaceutical manufacturers evaluate EM data quality, select appropriate statistical models, quantify false-alert performance and assess predictive-model validity.
Planning an EM trend analysis? Contact Statswork to discuss your dataset, analytical objectives and validation requirements.
Conclusion
Published research supports statistical analysis of microbial counts, recovery frequency, excursion rates and long-term monitoring patterns. EU GMP Annex 1 establishes expectations for trend review and excursion response but does not mandate predictive algorithms. EM trends may provide earlier warning of deteriorating control. Reliable prediction of future contamination must be demonstrated for the intended application through predefined outcomes, independent validation, an acceptable false-alert burden and useful lead time.
Frequently Asked Questions (FAQs)
EM trends can flag deteriorating environmental control, but reliable prediction of future contamination requires independent validation.
Annex 1 expects manufacturers to review adverse trends, investigate excursions and integrate findings into the Contamination Control Strategy (CCS).
Common methods include control charts, binomial regression, Poisson or negative binomial models, and EWMA or CUSUM, depending on the data.
They can monitor changes in recovery rates, recurring excursions and microbial patterns using predefined statistical rules alongside routine EM review.
Define the outcome and warning horizon, assess false alerts and missed events, and test performance on independent data not used to develop the model.
References:
- European Commission. EudraLex Volume 4, EU Guidelines for Good Manufacturing Practice, Annex 1: Manufacture of Sterile Medicinal Products. 2022, Sections 9.10–9.13. https://health.ec.europa.eu/document/download/e05af55b-38e9-42bf-8495-194bbf0b9262_en?filename=20220825_gmp-an1_en_0.pdf
- Bar R. Charting and Evaluation of Environmental Microbial Monitoring Data. PDA J Pharm Sci Technol. 2015 Nov-Dec;69(6):743-61. doi: 10.5731/pdajpst.2015.01079. PMID: 26659105. https://pubmed.ncbi.nlm.nih.gov/26659105/
- Gurijala, K. R., and Barnett, A. (2021). “Statistical Method for Trending of Excursions in Clean Room Microbiological Monitoring Data.” PDA Journal of Pharmaceutical Science and Technology, 75(5), 407–424. https://doi.org/10.5731/pdajpst.2020.011791
- Caputo, R. A., and Huffman, A. (2004). “Environmental Monitoring: Data Trending Using a Frequency Model.” PDA Journal of Pharmaceutical Science and Technology, 58(5), 254–260. PMID: 15568646 https://journal.pda.org/content/58/5/254
- Yang, H., Zhao, W., O’Day, T., and Fleming, W. (2013). “Environmental Monitoring: Setting Alert and Action Limits Based on a Zero-Inflated Model.” PDA Journal of Pharmaceutical Science and Technology, 67(1), 2–8. PMID: 23385559 https://pubmed.ncbi.nlm.nih.gov/23385559/
- Tanna, J., et al. (2024). “Environmental Monitoring of cGMP Cleanroom Facilities for Manufacturing of Cellular Therapy Products in an Academic Hospital Setting.” Cytotherapy, 26(11), 1421–1428. https://doi.org/10.1016/j.jcyt.2024.06.008
- Cundell AM, Bean R, Massimore L, Maier C. Statistical analysis of environmental monitoring data: does a worst case time for monitoring clean rooms exist? PDA J Pharm Sci Technol. 1998 Nov-Dec;52(6):326-30. PMID: 10050131. https://pubmed.ncbi.nlm.nih.gov/10050131/
- Collins, G. S., et al. (2024). “TRIPOD+AI Statement: Updated Guidance for Reporting Clinical Prediction Models That Use Regression or Machine Learning Methods.” BMJ, 385, e078378. https://doi.org/10.1136/bmj-2023-078378