- Services
- Data Analysis services
- Sample Work
Data Analysis services
- Secondary Qualitative Research Services
- Secondary Quantitative Research Services
- Meta-Analysis Research services
- Sample Work
Meta-Analysis Research Services
- Data Collection Services
- Sample Work
Data Collection Services
- Statistical & Biostatistics services
- Sample Work
Statistical Programming & Biostatistics services
- Data Management Services
- Sample Work
Data Management Services
- Research methodology services
- Sample Work
Research methodology services
- Tool Development Services
- Sample Work
Tool development services
- Statistical Interpretation services
-
Statistical Interpretation services
- Sample Work
Statistical Interpretation services
-
- Sample Size Calculation Services
-
Sample Size Calculation Services
- Sample Work
Sample Size Calculation Services
-
- AI & ML Services
-
Artificial Intelligence and Machine Learning Services
- Sample Work
Artificial Intelligence and Machine Learning Services
-
- Meaningful Visualization Services
- Thought Leadership Services
- Report Generation Services
-
Report generation Service
- Sample Work
Report generation Services
-
- Data Analysis services
- Industries
- About Us
- Blog
- Insights
- Contact Us
Empowering Research with SPSS & Stata: A Modern Analyst’s Guide
Qualitative Research Service
News & Trends
Recommended Reads
Contact us
Introduction
In today’s rapidly evolving research environment, the skill of being able to interpret big data is no longer a nice-to-have, but a necessity. SPSS and Stata for research purposes have become an essential component of any researcher’s toolkit, regardless of the field of study, be it social sciences, healthcare, or economics.
These statistical software packages provide an excellent solution for data management, data analysis, and interpretation. Whether you are a new researcher or an experienced one, knowing how to effectively use these software packages can make all the difference in the quality of your research.[1]
Why SPSS and Stata Are Game-Changers
In contemporary research, employing statistical software for researchers is no longer a choice—it is a necessity for efficiently managing complex data. SPSS and Stata are particularly useful for simplifying analysis while ensuring the accuracy of results:
- Intuitive Interfaces: Each software has friendly interfaces that simplify the process of managing data and analysis.
- Powerful Statistical Capabilities: Each software can handle analyses that cannot be done using spreadsheets or manual calculations.
- Reproducible Workflows: Each software allows researchers to easily track their analyses, ensuring accuracy and reliability of results.
- Faster Insights: Both software save time by automating calculations and creating visualizations, allowing researchers to spend more time interpreting results.
- Research-Focused: Choosing the right software for your research goals ensures accurate and reliable results.[1]
Getting Started with SPSS and Stata
For those who are new to the field, a step-by-step SPSS guide for beginners can be very helpful. Key points to remember for beginners:
- Installation and Setup: To install SPSS and Stata, one needs to follow a proper procedure.
- User Interface Familiarity: Learn to understand the menus, toolbars, and workflow variations between SPSS and Stata.
- Importing Data: Understand how to import data from different sources for analysis.
- Basic Commands: Learn the key operations in both software.
- Focus on Core Features: Before delving into the advanced features, one needs to master the basic operations.
- Reproducibility and Efficiency: Stata is more focused on replicable workflows, whereas SPSS provides easy-to-use tools for rapid analysis.
Mastering Data Management
Effective research requires clean and organized data. The important points about data management using SPSS and Stata are:
- Handling Large Datasets: Stata data management techniques are appropriate for handling large and complex data efficiently.
- Data Cleaning: Missing values in data should be identified and managed for better accuracy and reliability of data.
- Variable Transformation: Data should be prepared for analysis by creating, recoding, and manipulating variables.
- Data Preparation in SPSS: Using SPSS, data can be coded, categorized, and rearranged in an organized manner.
- Reproducible Workflows: Data management should be done in a way that allows replication of analysis.
- Error Reduction: Organized data management procedures help in saving time and reducing errors in the subsequent analysis process.[3]
Core Statistical Analyses
Once data is clean, the researchers can start to analyse it. Data analysis with SPSS and Stata can perform many critical statistical techniques for data analysis.
- Descriptive Statistics: Summary and distribution analysis is accomplished with basic summary statistics.
- Cross-Tabulations: Comparisons of variables reveal relationships among and/or trends across those variables.
- Data Visualization: Patterns may be identified with the aid of charts and graphs.
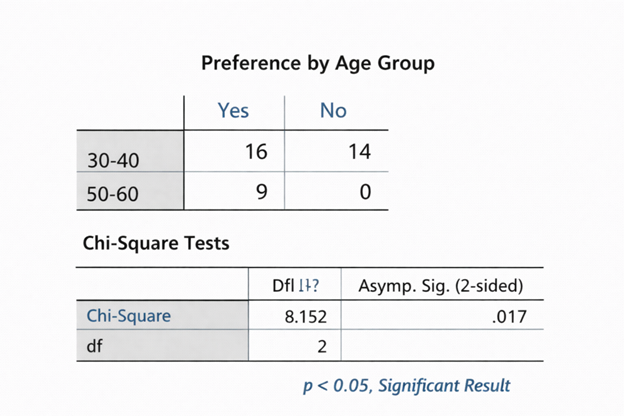
- Inferential Testing: The use of t-test, ANOVA, and chi-square tests are used to perform hypothesis testing.
- Regression Modelling: Regression analysis in Stata is a tool to identify relationships and ultimately predict.
- Insight Generation: In summary, these techniques facilitate the transformation of complex data into useful insight.[4]
Overcoming Common Challenges
| Challenge | How to Address It |
|---|---|
| Handling large datasets | Effectively manage and handle data by using approaches that provide for efficient processing of data that is large in volume. |
| Managing errors | Troubleshoot and thoroughly review all output to minimize errors. |
| Interpreting results | Develop an understanding of all statistical outputs to reach the correct conclusion. |
| Skill gaps | Enhance your analytical ability and confidence by utilizing SPSS tutorials for research. |
| Complex analysis needs | Acquire expertise in the data cleaning process, model selection, and result verification from a professional data analyst. |
| Time and resource constraints | The assistance provided by an SPSS data analysis service to complete complex projects efficiently and on time.[5] |
Exploring Advanced Analytics
- More elaborate methods of statistics will be needed for advanced research.
- Advanced statistical techniques with SPSS (multivariate analysis, factor analysis, generalized linear models) available through SPSS.
- Automating tools/macros will assist in splicing out repetitive activities.
- SPSS and Stata interface with Excel/R/Python.
- These features also allow for more in-depth insight than simply performing basic analyses.
Conclusion
The incorporation of SPSS and Stata into the research process improves analytical strength by allowing researchers to easily use the software. Knowledge of how to use SPSS and Stata for research work enables researchers to produce accurate information, which improves the effectiveness of contemporary research.
Turn complex datasets into clear conclusions with StatsWork’s SPSS & Stata data analysis services
Reference
- Hodges, C. B., Stone, B. M., Johnson, P. K., Carter III, J. H., Sawyers, C. K., Roby, P. R., & Lindsey, H. M. (2023). Researcher degrees of freedom in statistical software contribute to unreliable results: A comparison of nonparametric analyses conducted in SPSS, SAS, Stata, and R. Behavior Research Methods, 55(6), 2813-2837. https://link.springer.com/article/10.3758/s13428-022-01932-2
- Mitchell, M. N. (2010). Data management using Stata: A practical handbook. College Station, TX: Stata press. https://www.stata-press.com/books/preview/dmus2-preview.pdf
- Whittier, N. E., Wildhagen, T., & Gold, H. J. (2019). Statistics for social understanding: With stata and SPSS. Bloomsbury Publishing PLC. https://books.google.com/books?hl=en&lr=&id=9PuBDwAAQBAJ&oi=fnd&pg=PP1&dq=Core+Statistical+Analysis+SPSS
- Cleff, T. (2019). Applied statistics and multivariate data analysis for business and economics: A modern approach using SPSS, Stata, and Excel. Springer. https://books.google.com/books?hl=en&lr=&id=9tOhDwAAQBAJ&oi=fnd&pg=PR5&dq=challenges+SPSS+and+Stata&ots=O-hFAs9ZA-&sig=CH4nj_Fr5EKcz9g1mYOVaTdkbh0