- Services
- Data Analysis services
- Sample Work

Data Analysis services
- Secondary Qualitative Research Services
- Secondary Quantitative Research Services
- Meta-Analysis Research services
- Sample Work

Meta-Analysis Research Services
- Data Collection Services
- Sample Work

Data Collection Services
- Statistical & Biostatistics services
- Sample Work

Statistical Programming & Biostatistics services
- Data Management Services
- Sample Work

Data Management Services
- Research methodology services
- Sample Work

Research methodology services
- Tool Development Services
- Sample Work

Tool development services
- Statistical Interpretation services
-
Statistical Interpretation services
- Sample Work

Statistical Interpretation services
-
- Sample Size Calculation Services
-
Sample Size Calculation Services
- Sample Work

Sample Size Calculation Services
-
- AI & ML Services
-
Artificial Intelligence and Machine Learning Services
- Sample Work

Artificial Intelligence and Machine Learning Services
-
- Meaningful Visualization Services
- Thought Leadership Services
- Report Generation Services
-
Report generation Service
- Sample Work

Report generation Services
-
- Data Analysis services
- Industries
- About Us
- Blog
- Insights
- Contact Us
- Services
- Data Analysis services
- Sample Work
Data Analysis services
- Secondary Qualitative Research Services
- Secondary Quantitative Research Services
- Meta-Analysis Research services
- Sample Work
Meta-Analysis Research Services
- Data Collection Services
- Sample Work
Data Collection Services
- Statistical & Biostatistics services
- Sample Work
Statistical Programming & Biostatistics services
- Data Management Services
- Sample Work
Data Management Services
- Research methodology services
- Sample Work
Research methodology services
- Tool Development Services
- Sample Work
Tool development services
- Statistical Interpretation services
-
Statistical Interpretation services
- Sample Work
Statistical Interpretation services
-
- Sample Size Calculation Services
-
Sample Size Calculation Services
- Sample Work
Sample Size Calculation Services
-
- AI & ML Services
-
Artificial Intelligence and Machine Learning Services
- Sample Work
Artificial Intelligence and Machine Learning Services
-
- Meaningful Visualization Services
- Thought Leadership Services
- Report Generation Services
-
Report generation Service
- Sample Work
Report generation Services
-
- Data Analysis services
- Industries
- About Us
- Blog
- Insights
- Contact Us
What Is Secondary Quantitative Data Collection and Why It Matters
Meta Analysis Service
- Understanding Quantitative Data in Research
- What is Secondary Quantitative Data Collection?
- Types and Sources of Secondary Data
- Why Use Secondary Quantitative Data in Research?
- Importance of Secondary Quantitative Data Collection in Research
- Applications for Secondary Quantitative Data
- Methods of Analyzing Secondary Quantitative Data
- Advantages and Limitations
- Best Practices for Using Secondary Quantitative Data
- Step-by-Step Guide to Secondary Quantitative Data Collection
- Conclusion
Recommended Reads
Contact us
Introduction to Secondary Quantitative Data Collection
Secondary quantitative data collection involves using existing numerical data collected by other people to conduct research. Researchers use existing datasets (according to specific methods) to conduct analyses rather than collect new information [1].
A common source of secondary quantitative data is research databases, public datasets, and survey information which make it an effective and efficient way to conduct modern research.
Understanding Secondary Quantitative Data in Research
Statistical data, often referred to as quantitative data, is numerical, measurable, and can be analyzed using statistical analysis to identify trends or associations.
Characteristics of Quantitative Data:
- Numerical
- Standardized and Structured
- Capable of being Statistically Analyzed
- Often Used to Compare or Forecast Results [2]
Quantitative Data Types:
| Type | Definition | Example |
| Discrete Data | Can be counted | Total Number of Employees Utilized at Any Given Time |
| Continuous Data | Can be measured | Temperature; Family Income |
What is Secondary Quantitative Data Collection?
Secondary quantitative data collection involves analyzing existing numerical data instead of collecting new data.
Examples
|
Simple Breakdown
|
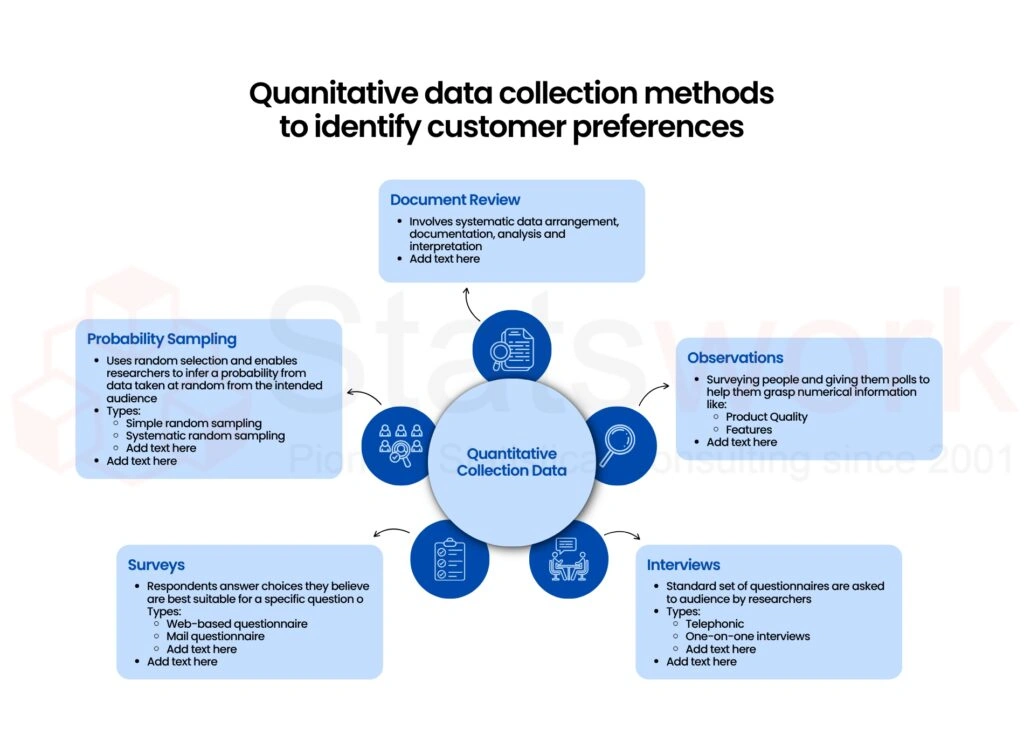
Types and Sources of Secondary Data
There are various sources of secondary data:
Major Sources
- Public Datasets – Government websites, census data
- Research Databases – Research papers, academic journals
- Survey Data – Market research reports, surveys
- Statistical Repositories – World Bank datasets, WHO datasets [3]
Source Comparison Table
| Source Type | Accessibility | Reliability | Example Use |
| Public Datasets | High | High | Policy research |
| Research Databases | Medium | Very High | Academic studies |
| Survey Data | Medium | Medium | Market trends |
Why Use Secondary Quantitative Data in Research?
By using secondary data, researchers can save time and money while at the same time having access to large-scale information.
Key Reasons
- Faster than Primary Data Collection
- Cost-Effective
- Access to Historical Data
- Enables Broader Statistical Analysis [4]
Importance of Secondary Quantitative Data Collection in Research
The importance of secondary quantitative data collection in research is based on the provision of support for evidence-based decisions.
Why It Matters
- Identifies long-term trends
- Increases accuracy of research findings
- Supports large-scale research analyses
- Supports comparative research analyses
Impact Overview
| Benefit | Research Impact |
| Trend Analysis | Better forecasting |
| Data Availability | Faster insights |
| Large Samples | Higher reliability |
Applications for Secondary Quantitative Data
Secondary quantitative data is commonly employed across industries:
Key Applications
- Business Research – Market trends and consumer behavior
- Healthcare – Disease patterns and clinical research
- Economics – GDP analysis and employment statistics
- Social Sciences – Population research
Use Case Snapshot
- Businesses use survey data to enhance products
- Governments use public data to inform policies [3]
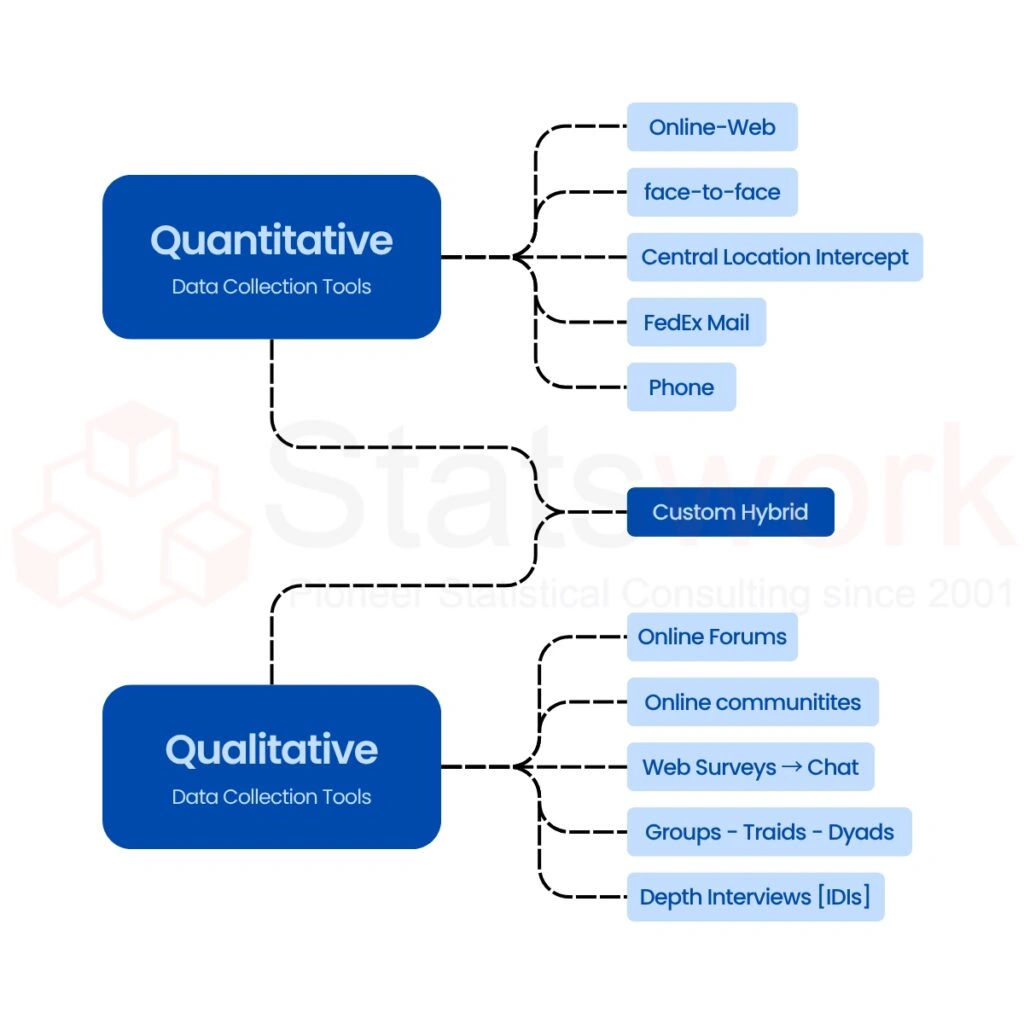
Methods of Analyzing Secondary Quantitative Data
Analyzing secondary data involves the following structured techniques:
|
Common Methods Descriptive Statistics Regression Analysis Trend Analysis Comparative Analysis |
Tools Used Excel SPSS R Python |
Process Flow Data Collection from Sources Data Cleaning Statistical Analysis Interpretation |
Advantages and Limitations
Advantages
- Cost-efficient
- Timesaving
- Access to large data sets
- Useful for longitudinal research
Limitations
- Outdated data
- Limited control over data quality
- Not necessarily suited for research purposes [2]
Comparison Table
| Aspect | Advantage | Limitation |
| Cost | Low | — |
| Accuracy | Depends on source | May vary |
| Relevance | Broad | Not always specific |
Best Practices for Using Secondary Quantitative Data
Do’s
|
Don’ts
|
Checklist
- Source credibility
- Data accuracy
- Relevance to research objective
Step-by-Step Guide to Secondary Quantitative Data Collection
Step-by-Step Process
- Define research objective
- Identify relevant public datasets and survey data
- Access research databases
- Collect and organize data
- Perform statistical analysis
- Interpret results
- Present findings
Workflow Table
Step Action
| Define Objective | Describe what you would like to research or analyze. |
| Identify Sources | Identify relevant public data sets, survey results, or research databases. |
| Collect Data | Gather necessary secondary quantitative data [4]. |
| Analyze | Apply statistical analysis to gain insights. |
| Report Insights | Present findings in a clear and actionable manner. |
Conclusion
Secondary quantitative data collection is vital in the modern research world as it offers accessible, scalable, and data-driven insights.
It assists in the effective utilization of publicly available data, surveys, and research data in carrying out significant statistical analysis, thus making it a vital tool in decision-making processes.
CTA – Turn existing data into powerful insights with Statswork—start today.
References:
- Lim, W. M. (2025). What is quantitative research? An overview and guidelines. Australasian Marketing Journal, 33(3), 325-348. http://journals.sagepub.com/doi/full/10
- Davidson, E., Edwards, R., Jamieson, L., & Weller, S. (2019). Big data, qualitative style: a breadth-and-depth method for working with large amounts of secondary qualitative data. Quality & quantity, 53(1), 363-376. https://link.springer.com/article/10.1007
- Sadan, V. (2017). Data collection methods in quantitative research. Indian Journal of Continuing Nursing Education, 18(2), 58-63. https://journals.lww.com/ijcn/fulltext/2017
- Cartaxo, A., Koller, M., Mayer, H., Kolland, F., & Nagl-Cupal, M. (2023). Risk factors with the greatest impact on caregiver burden in informal homecare settings in Austria: A quantitative secondary data analysis. Health & Social Care in the Community, 2023(1), 3270083. https://onlinelibrary.wiley.com/doi/full/10
- Garba, T. (2023). Research Methodology: A Quantitative Approach. Research Methodology. https://www.researchgate.net/profile