
- Services
- Data Analysis services
- Sample Work
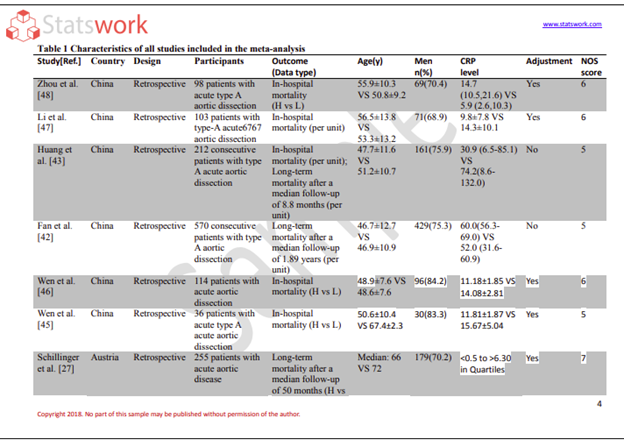
Data Analysis services
- Secondary Qualitative Research Services
- Secondary Quantitative Research Services
- Meta-Analysis Research services
- Sample Work

Meta-Analysis Research Services
- Data Collection Services
- Sample Work
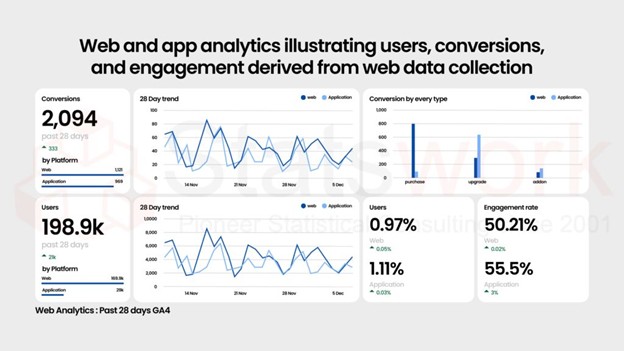
Data Collection Services
- Statistical & Biostatistics services
- Sample Work
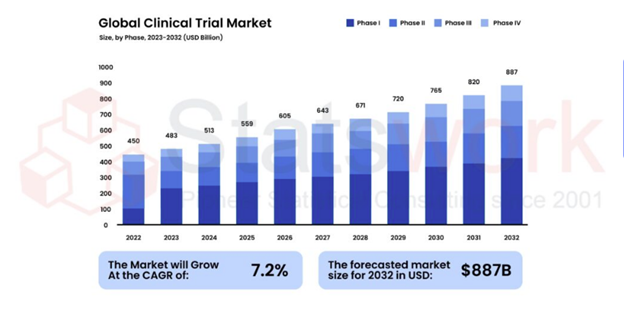
Statistical Programming & Biostatistics services
- Data Management Services
- Sample Work
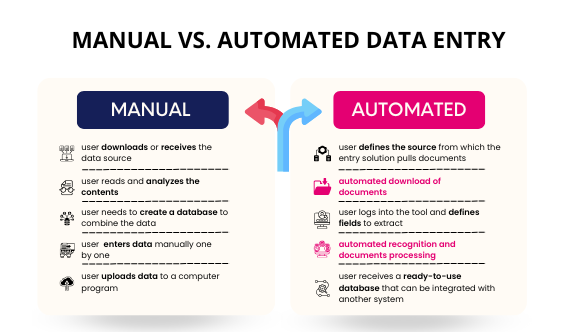
Data Management Services
- Research methodology services
- Sample Work
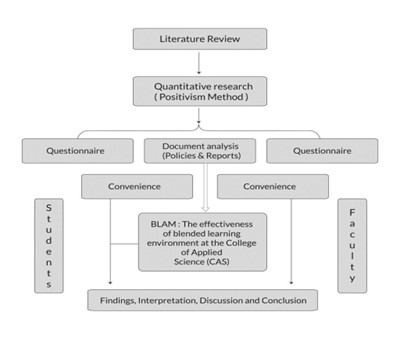
Research methodology services
- Tool Development Services
- Sample Work
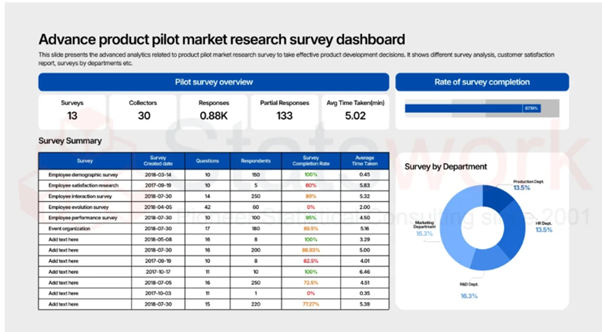
Tool development services
- Statistical Interpretation services
-
Statistical Interpretation services
- Sample Work
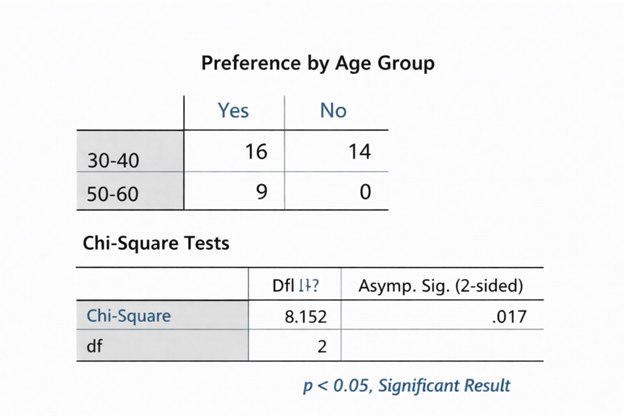
Statistical Interpretation services
-
- Sample Size Calculation Services
-
Sample Size Calculation Services
- Sample Work
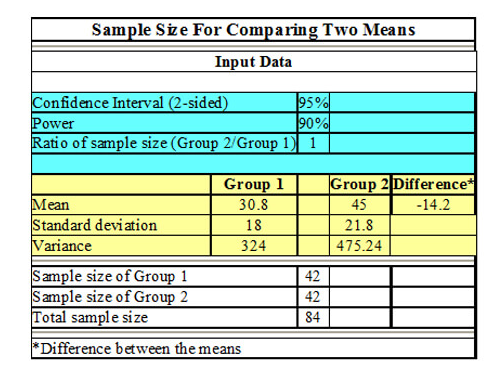
Sample Size Calculation Services
-
- AI & ML Services
-
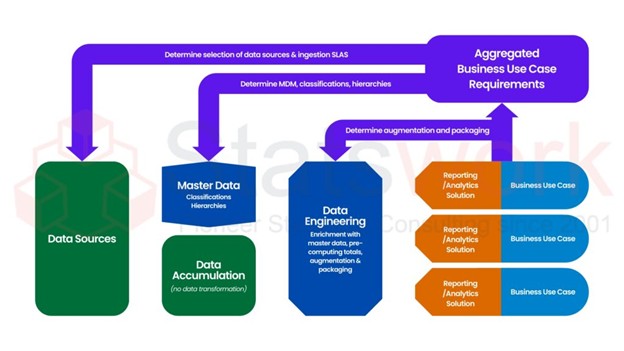
Artificial Intelligence and Machine Learning Services
- Sample Work
Artificial Intelligence and Machine Learning Services
-
- Meaningful Visualization Services
- Thought Leadership Services
- Report Generation Services
-
Report generation Service
- Sample Work

Report generation Services
-
- Data Analysis services
- Industries
- About Us
- Blog
- Insights
- Contact Us
- Services
- Data Analysis services
- Sample Work
Data Analysis services
- Secondary Qualitative Research Services
- Secondary Quantitative Research Services
- Meta-Analysis Research services
- Sample Work
Meta-Analysis Research Services
- Data Collection Services
- Sample Work
Data Collection Services
- Statistical & Biostatistics services
- Sample Work
Statistical Programming & Biostatistics services
- Data Management Services
- Sample Work
Data Management Services
- Research methodology services
- Sample Work
Research methodology services
- Tool Development Services
- Sample Work
Tool development services
- Statistical Interpretation services
-
Statistical Interpretation services
- Sample Work
Statistical Interpretation services
-
- Sample Size Calculation Services
-
Sample Size Calculation Services
- Sample Work
Sample Size Calculation Services
-
- AI & ML Services
-
Artificial Intelligence and Machine Learning Services
- Sample Work
Artificial Intelligence and Machine Learning Services
-
- Meaningful Visualization Services
- Thought Leadership Services
- Report Generation Services
-
Report generation Service
- Sample Work
Report generation Services
-
- Data Analysis services
- Industries
- About Us
- Blog
- Insights
- Contact Us
No Trial Compares the Treatments Swiss Hospitals Actually Use: When Should You Use Network Meta-Analysis?
Meta-Analysis Services
- Start With the Swiss Decision, Not the Network
- How an Indirect Comparison Is Calculated
- Build Coherent Treatment Nodes and Aligned Estimands
- Transitivity Is the Critical Assumption
- Choose the Model According to the Evidence
- Separate Heterogeneity from Inconsistency
- Do Not Confuse Ranking with Superiority
- When Should Swiss Healthcare Teams Use NMA?
- Conclusion
- FAQ
- Reference
Recommended Reads
Contact us
Summary
Swiss hospitals often choose between treatments that no single trial compares. Network meta-analysis can connect this fragmented evidence, but a credible estimate needs coherent treatment nodes, transitivity, appropriate heterogeneity modelling, tested consistency, honest uncertainty and relevance to Swiss practice.
The problem is rarely that no trial exists. More often, the evidence forms an incomplete network: trials compare A with C, B with C, D with C and A with D, but the decision needs B versus D. Network meta-analysis (NMA) can estimate that missing comparison, but only when the evidence pathways are clinically comparable. The goal is not the largest network; it is the most coherent network that can support a defensible decision.
Start With the Swiss Decision, Not the Network
The FOPH publishes hospital key figures and quality indicators, including case numbers, case-mix severity and mortality for selected conditions [7]. These data describe the Swiss care setting, but they do not establish comparative treatment effectiveness.
That distinction matters for reimbursement. FOPH’s operationalisation of the effectiveness, appropriateness and economic efficiency (EAE) criteria requires benefit and harm to be compared with alternative interventions. Where no head-to-head studies exist, indirect comparisons may be drawn, but their limitations, including differences between studies, must be discussed in depth [1].
Begin by defining the population, interventions, comparator, outcome, follow-up, setting and estimand relevant to the decision.
Table 1. Building an NMA relevant to Swiss decisions
Stage | Statistical question | Swiss decision relevance |
Decision set | Are these genuine treatment options? | Reflects real clinical choices |
Treatment nodes | Are interventions sufficiently comparable? | Prevents inappropriate pooling |
Effect modifiers | Are they balanced across comparisons? | Supports transitivity |
Estimand and outcomes | Does each study answer the same question? | Protects comparability |
Setting | Do trial settings resemble Swiss care? | Supports applicability |
How an Indirect Comparison Is Calculated
With C as the common comparator, the anchored (Bucher) indirect estimate works on the log odds-ratio scale [8]:
ln OR(BD) = ln OR(BC) − ln OR(DC)
Var [ln OR(BD)] = Var [ln OR(BC)] + Var [ln OR(DC)]
If OR(BC) = 0.84 and OR(DC) = 0.80, each with a log-scale standard error of 0.135, then OR(BD) = 1.05 (95% CI 0.72–1.53). The variances add, so the indirect estimate is always less precise than either direct input. Because randomisation is preserved within each trial, the result is valid only if patient severity, prior treatment, dose and follow-up are comparable across the two pathways [3, 4].
Build Coherent Treatment Nodes and Aligned Estimands
Each node should represent one clinically coherent intervention. Pooling materially different doses, procedures or combination regimens creates artificial heterogeneity. The effect measure should match the outcome: odds or risk ratios for binary outcomes, mean differences for continuous outcomes and hazard ratios for time-to-event outcomes [3].
Estimands matter equally. Two trials may both report a “treatment effect” while estimating a treatment-policy effect in one and an effect under full adherence in the other. Those contrasts are not exchangeable. Multi-arm trials also need covariance handling, because contrasts sharing an arm are correlated; treating them as independent overstates precision [3].
Transitivity Is the Critical Assumption
Transitivity requires important effect modifiers, such as severity, age, prior treatment, comorbidity and care setting, to be similarly distributed across comparisons [2, 4]. A prognostic factor predicts the outcome; an effect modifier changes the relative treatment effect. Only the second threatens transitivity when its distribution differs.
Suppose A–C trials mainly enrol severe patients and B–C trials mainly enrol mild patients. If severity modifies treatment effect, the indirect B–A estimate partly reflects population differences rather than treatment differences. Swiss applicability is a separate check: a coherent network can rest on populations unlike Swiss patients. Hospital data can describe the target population but cannot repair an intransitive network.
Choose the Model According to the Evidence
A fixed-effect model assumes one true effect per comparison. A random-effects model lets study effects vary around a network mean:
θₖ ~ N (d, τ²)
where θₖ is the true effect in study k, d is the network mean effect and τ² is between-study variance [3]. Random effects model variation; they cannot make incompatible nodes exchangeable. A prediction interval shows the plausible effect in a new comparable setting, but it does not by itself establish transportability to Switzerland.
Separate Heterogeneity from Inconsistency
Heterogeneity is variation among studies of the same comparison. Inconsistency is disagreement between direct and indirect evidence [5]. Suppose a B–D trial is later published with OR 0.70 (95% CI 0.50–0.98), against the indirect 1.05 (0.72–1.53).
The log difference is −0.41 with a standard error of 0.26, giving z = −1.57 and p = 0.12. The ratio of odds ratios is 0.67 (0.40–1.10). The test is not significant, yet it had only about 35% power to detect a true ratio of 0.67. A non-significant inconsistency test therefore does not prove coherence, particularly in sparse networks.
Node-splitting examines individual comparisons; design-by-treatment interaction models assess the whole network [5]. When disagreement appears, investigate why: severity, intervention definitions or follow-up may differ.
Table 2. What can weaken a Swiss NMA?
Problem | Statistical consequence | Appropriate response |
Broad treatment nodes | Artificial heterogeneity | Refine intervention definitions |
Unbalanced effect modifiers | Intransitivity | Assess clinical plausibility; consider meta-regression |
Different estimands | Non-comparable contrasts | Align or separate estimands |
Sparse network | Imprecision; low test power | Report uncertainty; avoid over-ranking |
Limited Swiss relevance | Indirectness | Compare population and setting |
Do Not Confuse Ranking with Superiority
SUCRA values and P-scores summarise rank probabilities, but a treatment can rank first while its advantage is small, uncertain or clinically unimportant [9]. CINeMA grades confidence across within-study bias, reporting bias, indirectness, imprecision, heterogeneity and incoherence [6]. The practical question is not “Which treatment ranks first?” but “How large is the difference, how certain is it, and would it change the Swiss decision?”
When Should Swiss Healthcare Teams Use NMA?
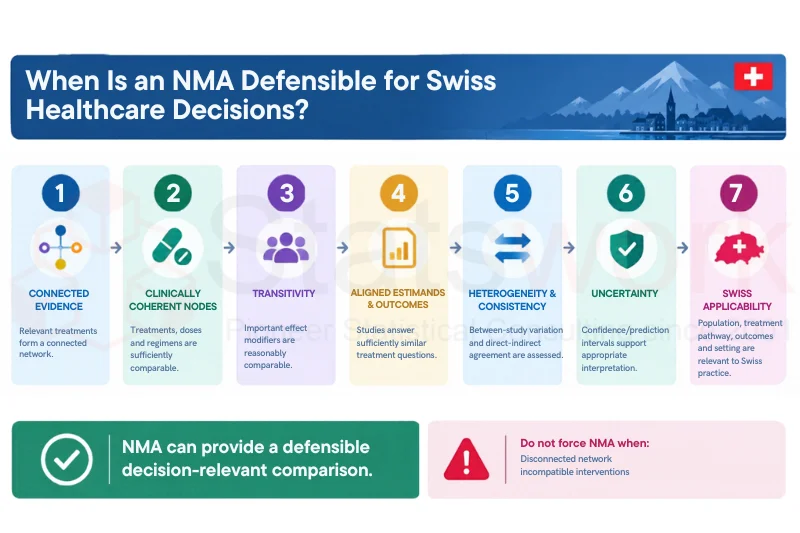
NMA is appropriate when relevant interventions form a connected network, direct randomised comparisons are incomplete, and studies are comparable enough for indirect inference, consistent with good-practice guidance for healthcare decision-making [2, 3]. It should not be forced when the network is disconnected, interventions are incompatible, major effect modifiers differ systematically or inconsistency remains unexplained.
How Statswork Supports Your NMA
Facing a treatment decision with no head-to-head trial? Statswork designs and executes network meta-analysis: defining treatment nodes, testing transitivity and consistency, modelling heterogeneity and assessing Swiss applicability.
You receive a reproducible analysis, CINeMA-graded results and a decision-ready report, not just a treatment ranking. Discuss your evidence network with a Statswork statistician.
Conclusion
NMA is most valuable when Swiss treatment options extend beyond direct randomised comparisons. Its credibility depends on coherent nodes, aligned estimands, transitivity, appropriate heterogeneity modelling, tested consistency and Swiss applicability. Evaluated together, these turn fragmented trials into decision-relevant estimates without overstating what the evidence supports.
Frequently Asked Questions (FAQs)
When several relevant interventions form a connected network, direct comparisons are incomplete, and trials are comparable enough for indirect inference.
Transitivity: important effect modifiers must be similarly distributed across the comparisons being linked.
No. SUCRA summarises ranking; it does not show that a difference is clinically meaningful or certain.
No. Hospital data describe case mix and care context; comparative effects should come from comparative studies
References:
- Federal Office of Public Health (FOPH). Operationalisation of the criteria “effectiveness, appropriateness and economic efficiency” according to Article 32 of the Federal Act on Health Insurance. Version 31 March 2022, valid from 1 September 2022. https://www.bag.admin.ch/dam/en/sd-web/dmmbS5sv9sve/Operationalisation%20of%20the%20EAE%20criteria%20of%2031.03.2022%2C%20valid%20from%2001.09.2022.pdf
- Jansen JP, Fleurence R, Devine B, et al. Interpreting indirect treatment comparisons and network meta-analysis for health-care decision making: ISPOR Task Force report, part 1. Value in Health. 2011;14(4):417–428. https://doi.org/10.1016/j.jval.2011.04.002
- Hoaglin DC, Hawkins N, Jansen JP, et al. Conducting indirect-treatment-comparison and network-meta-analysis studies: ISPOR Task Force report, part 2. Value in Health. 2011;14(4):429–437. https://doi.org/10.1016/j.jval.2011.01.011
- Jansen JP, Naci H. Is network meta-analysis as valid as standard pairwise meta-analysis? It all depends on the distribution of effect modifiers. BMC Medicine. 2013;11:159. https://doi.org/10.1186/1741-7015-11-159
- Jackson D, Barrett JK, Rice S, White IR, Higgins JPT. A design-by-treatment interaction model for network meta-analysis with random inconsistency effects. Statistics in Medicine. 2014;33(21):3639–3654. https://doi.org/10.1002/sim.6188
- Nikolakopoulou A, Higgins JPT, Papakonstantinou T, et al. CINeMA: An approach for assessing confidence in the results of a network meta-analysis. PLoS Medicine. 2020;17(4):e1003082. https://doi.org/10.1371/journal.pmed.1003082
- Federal Office of Public Health (FOPH). Facts and figures on hospitals. https://www.bag.admin.ch/en/facts-figures-on-hospitals
- Bucher HC, Guyatt GH, Griffith LE, Walter SD. The results of direct and indirect treatment comparisons in meta-analysis of randomized controlled trials. Journal of Clinical Epidemiology. 1997;50(6):683–691. https://doi.org/10.1016/S0895-4356(97)00049-8
- Salanti G, Ades AE, Ioannidis JPA. Graphical methods and numerical summaries for presenting results from multiple-treatment meta-analysis: an overview and tutorial. Journal of Clinical Epidemiology. 2011;64(2):163–171. https://doi.org/10.1016/j.jclinepi.2010.03.016