statswork

Stronger Analysis. Smarter Research. Bigger Savings!
Access expert statistical analysis and research support at Flat 24% Off
Stronger Analysis. Smarter Research. Bigger Savings!
Access expert statistical analysis and research support at Flat 24% Off.

Is Your Healthcare Service Next for FOPH Re-Evaluation? How a Meta-Analysis Can Strengthen Its Reimbursement Evidence

SUMMARY

FOPH re-evaluation can reopen the evidence question for a healthcare service already covered by compulsory health insurance. Switzerland assesses services against effectiveness, appropriateness and economic efficiency, while HTA examines evidence when these criteria require further assessment. A rigorous meta-analysis can strengthen the evidence package by combining comparable studies, quantifying treatment effects, measuring uncertainty, investigating heterogeneity and testing whether conclusions remain robust under reasonable assumptions.

Re-assessment of FOPH criteria can result in the re-assessment of healthcare services already being provided when the criteria for reimbursement need to be reconsidered. In the case of Switzerland, this system is used to assess not only drugs but also healthcare services in general. This can be enhanced by using the methodology of meta-analysis since it can summarize evidence that is similar into one quantitative effect estimate. It is not limited only to number of positive studies but also includes effect size, precision, heterogeneity and robustness.

Why FOPH Re-Evaluation Makes Meta-Analysis Important

A healthcare service may have substantial clinical experience behind it and still face renewed scrutiny when its reimbursement status is reassessed. Under Article 32, covered services must satisfy effectiveness, appropriateness and economic efficiency (EAE). FOPH states that compliance is periodically reviewed, while its HTA programme focuses particularly on services that may not meet the relevant criteria. [1]

This creates a statistical problem: a collection of favourable studies is not equivalent to a quantified evidence base. Reviewers need to understand the magnitude of the observed effect, its precision, differences between studies and the assumptions underlying the synthesis. Meta-analysis addresses this problem by statistically combining comparable study estimates into a pooled effect while retaining information about uncertainty and between-study variation. [2]
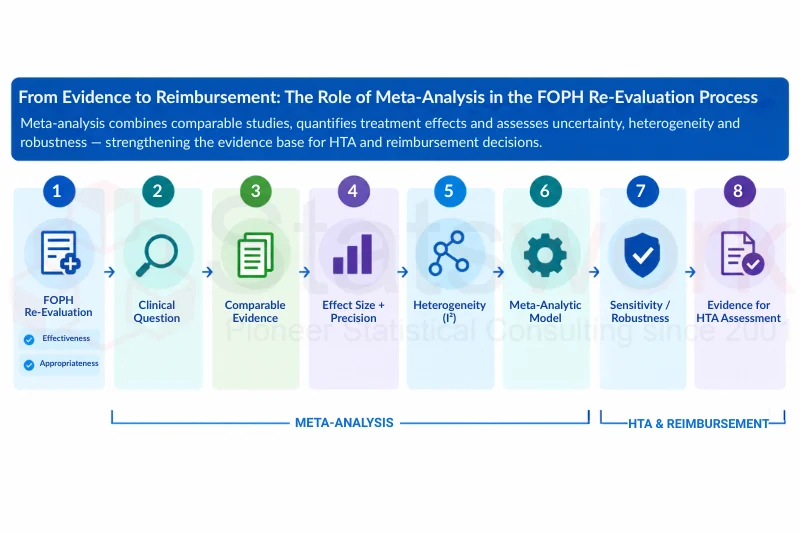
evidence synthesis

Figure 1. From evidence to reimbursement: the role of meta-analysis in the FOPH re-evaluation process.

Where Meta-Analysis Fits into the FOPH Framework

The EAE operationalisation valid from September 2022 is particularly relevant because FOPH describes it as the framework for assessing and designating all services covered by compulsory health insurance. The regulatory framework therefore provides the Swiss reimbursement context, while meta-analysis provides a quantitative method for synthesising suitable comparative evidence. [1]

A reimbursement-focused meta-analysis should connect its statistical question to the clinical question:

  • Is the service more effective than the relevant comparator?
  • What is the magnitude of the difference?
  • How precise is the pooled estimate?
  • Do effects vary materially across studies or patient groups?
  • Does the conclusion remain stable under justified sensitivity analyses?

Build a Comparable Evidence Set Before Pooling

Combining studies simply because they evaluate the same broad service can produce a precise but clinically misleading average if populations, comparators, outcomes or follow-up periods differ materially.

EXAMPLE | HYPOTHETICAL REHABILITATION SERVICE

Consider a hypothetical rehabilitation service being reassessed after surgery. Five comparative studies report hospital readmission, but follow-up ranges from 30 days to two years. Pooling them without considering this difference could mix clinically distinct outcomes. A defensible synthesis should define the population, service, comparator and outcome before extraction and explain which differences are acceptable for quantitative combination.


PRISMA 2020 supports transparent reporting of study identification, selection, data collection, analysis and reporting. [3] For reimbursement evidence, the analyst should document eligibility criteria, exclusions, outcome definitions, statistical methods and planned sensitivity analyses rather than presenting only the final pooled result.

Choose the Effect Measure That Matches the Outcome

The effect measure should answer the clinical question. Binary outcomes can use risk ratios, odds ratios or risk differences; continuous outcomes may use mean differences or standardised mean differences; time-to-event outcomes commonly use hazard ratios. The measure should be clinically interpretable and sufficiently consistent across studies to justify pooling.

Suppose five hypothetical studies evaluate whether a healthcare service reduces hospital readmission:

Study

Risk ratio (RR)

95% CI

Study 1

0.82

0.68–0.99

Study 2

0.91

0.73–1.14

Study 3

0.76

0.60–0.96

Study 4

0.88

0.71–1.09

Study 5

0.95

0.77–1.17

Pooled (fixed- effect)

0.86

0.78–0.95

Table 1. Hypothetical readmission studies. Pooled estimate calculated by inverse-variance weighting on the log scale (illustrative data).


WORKED EXAMPLE | INTERPRETING THE POOLED RESULT

Pooling the five hypothetical studies gives RR 0.86 (95% CI 0.78–0.95). This does not mean the service is “86% effective.” It indicates an estimated 14% relative reduction in the measured event compared with the comparator, subject to the assumptions and limitations of the synthesis.

Clinical interpretation should also consider absolute effects. If baseline readmission risk is 20%, an RR of 0.86 corresponds to an absolute reduction of approximately 2.8 percentage points (20% × 0.14). If baseline risk is 5%, the same relative effect corresponds to only about 0.7 percentage points.

Make Precision and Weighting Transparent

A pooled effect without its uncertainty interval provides an incomplete statistical picture. For a log-risk-ratio analysis, the standard error can be approximated from the confidence limits:

SE = [ln(upper CI) − ln(lower CI)] / 3.92


WORKED EXAMPLE | STUDY 1

For Study 1, with RR 0.82 and a 95% CI of 0.68–0.99:

SE = [ln (0.99) – ln (0.68)] / 3.92 = (−0.010 + 0.386) / 3.92 ≈ 0.096

Variance = SE² ≈ 0.0092; inverse-variance weight = 1 / 0.0092 ≈ 109 (before any random-effects adjustment).

Investigate Heterogeneity Instead of Hiding It

Study results rarely match exactly. Differences may reflect patient characteristics, service delivery, comparator care, outcome definitions, follow-up duration or study design. Higgins and colleagues described I² as a measure of the proportion of observed variation across studies that is due to heterogeneity rather than chance (sampling error). [4]

Consider two hypothetical evidence sets with the same point estimate:

Evidence set

Pooled RR

95% CI

I²

A (Table 1 studies)

0.86

0.78–0.95

0%

B

0.86

0.69–1.07

78%

Table 2. Same pooled RR, different consistency (illustrative data).

The identical point estimate does not make the evidence sets equivalent. Set B has greater between-study variation and a wider interval that includes no effect (RR 1.0). The analyst should investigate why results differ rather than treating I² as a pass-or-fail threshold.

Choose the Meta-Analytic Model Deliberately

Fixed-effect and random-effects models answer different questions. A fixed-effect model treats studies as estimating one common underlying effect, whereas a random-effects model allows underlying effects to vary between studies.

The choice becomes more difficult with few studies. Recent HTA methodology research specifically examines Bayesian random-effects approaches for meta-analyses with very few studies, highlighting the uncertainty in estimating between-study heterogeneity in small evidence bases. [5] Small evidence bases therefore require more methodological transparency, not less.

Make the Forest Plot Auditable

A forest plot should allow a reviewer to inspect each study’s effect estimate, confidence interval, contribution and relationship to the pooled result. It should be accompanied by the effect measure, model, confidence level and heterogeneity statistics.

Sensitivity analysis should test reasonable analytical choices, including:

  • excluding studies with important methodological concerns;
  • testing a justified alternative model;
  • examining the influence of unusually large or extreme studies; and
  • testing clinically justified outcome or follow-up definitions.

Separate Statistical Significance from Reimbursement Relevance

A statistically significant pooled effect does not automatically establish that a service should remain reimbursed. FOPH’s framework considers effectiveness, appropriateness and economic efficiency, so meta-analysis should be presented as one component of the wider evidence assessment. [1]

A strong reimbursement-oriented synthesis should therefore answer:

  • What is the estimated effect?
  • How certain and consistent is that effect?
  • How clinically meaningful is it for the population under assessment?

A Swiss HTA Example: Translating the Policy Question into Evidence

REAL-WORLD EXAMPLE | FOPH HTA PROTOCOL

FOPH’s HTA work provides a useful real-world context. In an HTA protocol for multigene-expression tests in early breast cancer, the policy question asks whether specified technologies meet the effectiveness, appropriateness and economic-efficiency criteria for decision-making on adjuvant chemotherapy. The protocol demonstrates how a Swiss reimbursement question can be translated into a defined population, technology, comparator and clinical decision. [6]


For questions with several comparable studies, meta-analysis can strengthen this evidence assessment by estimating the average effect, quantifying uncertainty and testing whether results vary materially across studies.

What a Re-Evaluation-Ready Meta-Analysis Should Demonstrate

Requirement

What the analysis should demonstrate

Defined question

Population, service, comparator and outcomes are explicit

Effect estimation

Appropriate effect measure and pooled estimate

Precision

Confidence interval and, where appropriate, prediction interval

Heterogeneity

I² and between-study variation are reported and interpreted

Model choice

Fixed or random effects model is justified

Robustness

Sensitivity and influence analyses are documented

Transparency

Search, selection, extraction and statistical methods are reproducible

Table 3. Re-evaluation readiness checklist for a reimbursement-focused meta-analysis

What Meta-Analysis Cannot Do

Meta-analysis cannot make fundamentally incompatible studies comparable. It cannot remove bias from poorly designed studies, recover outcomes that were never measured or establish economic efficiency from clinical effect estimates alone. More studies do not automatically mean better evidence.

Its defensible role is to organise comparable evidence into a quantitative estimate whose magnitude, uncertainty, consistency and robustness can be examined systematically.

Why the Analysis Should Begin Before Re-Evaluation

Waiting until formal reassessment begins can reveal problems when there is little time to address them. Early analysis can identify incompatible outcome definitions, under-represented populations, excessive heterogeneity or conclusions driven by individual studies.
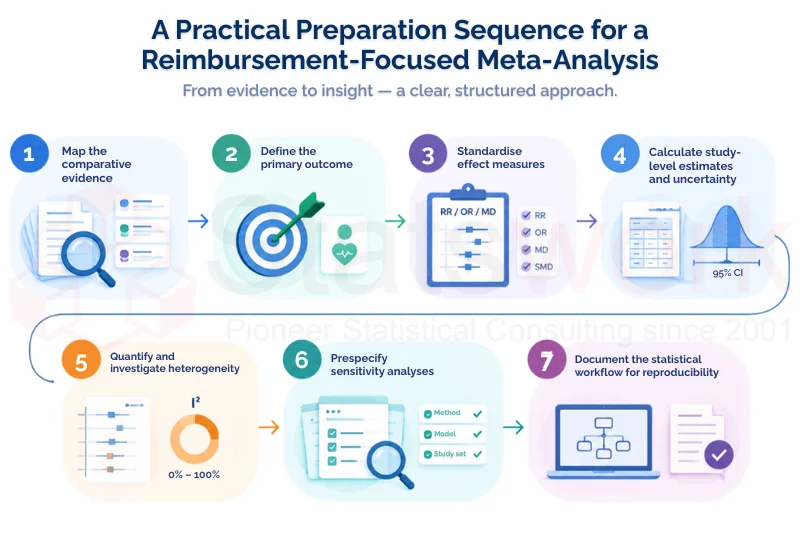
statistical analysis (2)

Figure 2. A practical preparation sequence for a reimbursement-focused meta-analysis.

This approach allows the evidence team to understand the strengths and limitations of its quantitative case before the reassessment process begins. This is particularly valuable when reimbursement depends on evidence across several studies.

Conclusion

FOPH re-evaluation places healthcare-service evidence within a framework of effectiveness, appropriateness and economic efficiency. Meta-analysis can strengthen that evidence by quantifying effects, uncertainty and heterogeneity across comparable studies. It cannot guarantee reimbursement, but it can make the clinical evidence more transparent, reproducible and statistically defensible.

Strengthen Your Evidence Before FOPH Re-Evaluation

If your healthcare service is approaching reimbursement reassessment, Statswork can strengthen the statistical evidence behind your case. Our Statistical Synthesis & Meta-Analysis services support evidence synthesis, effect-size estimation, heterogeneity assessment, statistical analysis and interpretation of pooled results. Whether you are developing a new meta-analysis or strengthening existing evidence, Statswork helps ensure that your analyses are rigorous and transparent.

Explore Statswork’s Statistical Synthesis & Meta-Analysis services to build stronger, data-driven reimbursement evidence.

Frequently Asked Questions (FAQs)

No. The EAE framework is intended for services covered by compulsory health insurance, including healthcare services beyond medicines.

No. Meta-analysis contributes quantitative evidence, particularly to the assessment of comparative effectiveness where appropriate. FOPH’s broader assessment also considers appropriateness, economic efficiency and other HTA dimensions.

No. Model selection should reflect the clinical and statistical assumptions of the evidence base. Where underlying effects are expected to vary, a random-effects approach may be appropriate, but it should be justified rather than selected automatically.

Heterogeneity shows how much study results differ beyond what might be expected from sampling variation. Investigating its sources can reveal differences in populations, interventions, comparators, outcomes or study methodology.

A strong analysis should have a clearly defined question, transparent study selection, appropriate effect measures, justified statistical methods, uncertainty estimates, heterogeneity assessment, sensitivity analyses and reproducible reporting.

References:

  1. Federal Office of Public Health (FOPH). Operationalisation of the Criteria “Effectiveness, Appropriateness and Economic Efficiency” (EAE). Federal Department of Home Affairs; 31 March 2022, valid from 1 September 2022. Bern: Swiss Confederation. https://www.bag.admin.ch/en/health-insurance-description-of-services
  2. Berlin JA, Golub RM. Meta-analysis as evidence: building a better pyramid. 2014;312(6):603–605. doi:10.1001/jama.2014.8167. https://pubmed.ncbi.nlm.nih.gov/25117128/
  3. Page MJ, McKenzie JE, Bossuyt PM, et al. The PRISMA 2020 statement: an updated guideline for reporting systematic reviews. 2021;372:n71. doi:10.1136/bmj.n71. https://doi.org/10.1136/bmj.n71
  4. Higgins JPT, Thompson SG, Deeks JJ, Altman DG. Measuring inconsistency in meta-analyses. 2003;327(7414):557–560. doi:10.1136/bmj.327.7414.557. https://pubmed.ncbi.nlm.nih.gov/12958120/
  5. Lilienthal J, Sturtz S, Schürmann C, et al. Bayesian random-effects meta-analysis with empirical heterogeneity priors for application in health technology assessment with very few studies. Research Synthesis Methods. 2024;15(2):275–287. doi:10.1002/jrsm.1685. https://pubmed.ncbi.nlm.nih.gov/38152969/
  6. Federal Office of Public Health (FOPH). HTA Protocol: Multigene-Expression Tests in Early Breast Cancer (HTA project H0067). Bern: Swiss Confederation. https://www.bag.admin.ch/dam/it/sd-web/2qIi4fqNRs03/h0067gemk-sh-hta-protocol.pdf

Contact us