Power BI Dashboard Development for Secondary Quantitative Data Collection
- Home
- Insights
- Article
- Power BI Dashboard Development for Secondary Quantitative Data Collection
Qualitative Research Service
- Role of Secondary Quantitative Data Collection in Power BI Analytics
- Common Sources of Secondary Quantitative Data
- Benefits of Power BI Dashboard Development PDF Tutorials and Learning Resources
- Power BI Dashboard Development Example in Quantitative Research
- Importance of Power BI Dashboard Development PDF Resources
- Power BI Dashboard Design Templates for Report Creation
- Power BI Dashboard Design Best Practices for Research Analytics
- The Future of Power BI Dashboard Development in Quantitative Research
- Conclusion
News & Trends
Recommended Reads

Data Collection
As the data collection methods have extreme influence over the validity of the research outcomes, it is considered as the crucial aspect of the studies
- 1. Introduction
- 2. DeepHealth’s Diagnostic Suite™: Revolutionizing Radiology Workflows
- 3. Key Features
- 4. AI Impact on National Screening Programs
- 5. SmartMammo™: Enhancing Breast Cancer Screening
- 6. DeepHealth AI Use Cases Across Specialties
- 7. Strategic Collaborations and Ecosystem Expansion
- 8. Impact and Adoption of DeepHealth’s AI Solutions
- 9. Conclusion: The Future of Radiology with AI
- 10. References
Introduction to Power BI Dashboard Development
The design of Power BI dashboard is currently becoming an important aspect of data analysis and business intelligence activities. The use of Power BI by both organizations and analysts has become a trend towards the creation of impressive interactive reports and dashboards. The process of collecting secondary quantitative data involves the use of Power BI in the analysis of previously generated numeric data such as those found in government reports, scientific publications, healthcare data, and surveys among others.
Unlike spreadsheet programs, Power BI dashboards offer the capability to provide real-time data analysis and automation of report generation along with interactive visual representations for easy decision-making.
Role of Secondary Quantitative Data Collection in Power BI Analytics
Collection of secondary quantitative data is the activity of using already available numerical information collected by other parties. This data is used by researchers to determine various trends, patterns, relationships, and business intelligence without having to conduct primary research.
Common Sources of Secondary Quantitative Data
| Data Source | Explanation |
| Government Sources | Census information, economic data, employment figures |
| Research Publications | Scientific literature, case studies |
| Medical Data | Medical databases, hospital data |
| Business Data | Financial statements, sales figures |
| Digital Sources | Free databases, online archives |
Creation of Power BI dashboards for secondary quantitative data gathering helps in arranging such data into valuable visual representations and dashboards.
Benefits of Power BI Dashboard Development PDF Tutorials and Learning Resources
Power BI feature of having an interactive dashboard is vital to the analysis process. It is not unusual to find scientists working on several data sets that have different variables.
Key Benefits of Power BI Dashboard Development
- Data centralization
- Real-time data reporting and analysis
- Charts and graphs representation
- Data refresh options
- More accurate research findings
- Enhanced business intelligence report creation
- Quick decision-making processes
Some other features of Power BI include cloud-based collaboration where members can have remote access to reports and dashboards on different devices.
Power BI Dashboard Development Example in Quantitative Research
Examples of Power BI dashboard design are numerous; for instance, they include applications in the healthcare industry, financial field, educational institutions, retail stores, and market research firms.
Examples of Dashboard Applications
| Industry | Dashboard Uses |
| Healthcare | Patient data analysis and disease tracking |
| Finance | Revenue tracking and financial forecasting |
| Education | Student performance analysis |
| Retail | Customer and sales analysis |
| Market Research | Consumer trend visualization |
For example, healthcare researchers can use Power BI dashboards to analyze patient demographics, treatment outcomes, and hospital performance using secondary datasets.
Importance of Power BI Dashboard Development PDF Resources
The PDF resources associated with Power BI dashboard creation are considered highly relevant for educational, instructional, and practical applications. This is because the PDF files offer essential information about dashboard creation, data modeling, and visualization.
Information Covered in PDF Guides
- Dashboard design
- Data modeling strategies
- Visualization methods
- KPIs integration
- Reports customization
- Data integration
It is common for academics and business analysts to use PDF files to learn about the best practices of creating Power BI reports and visualizations.
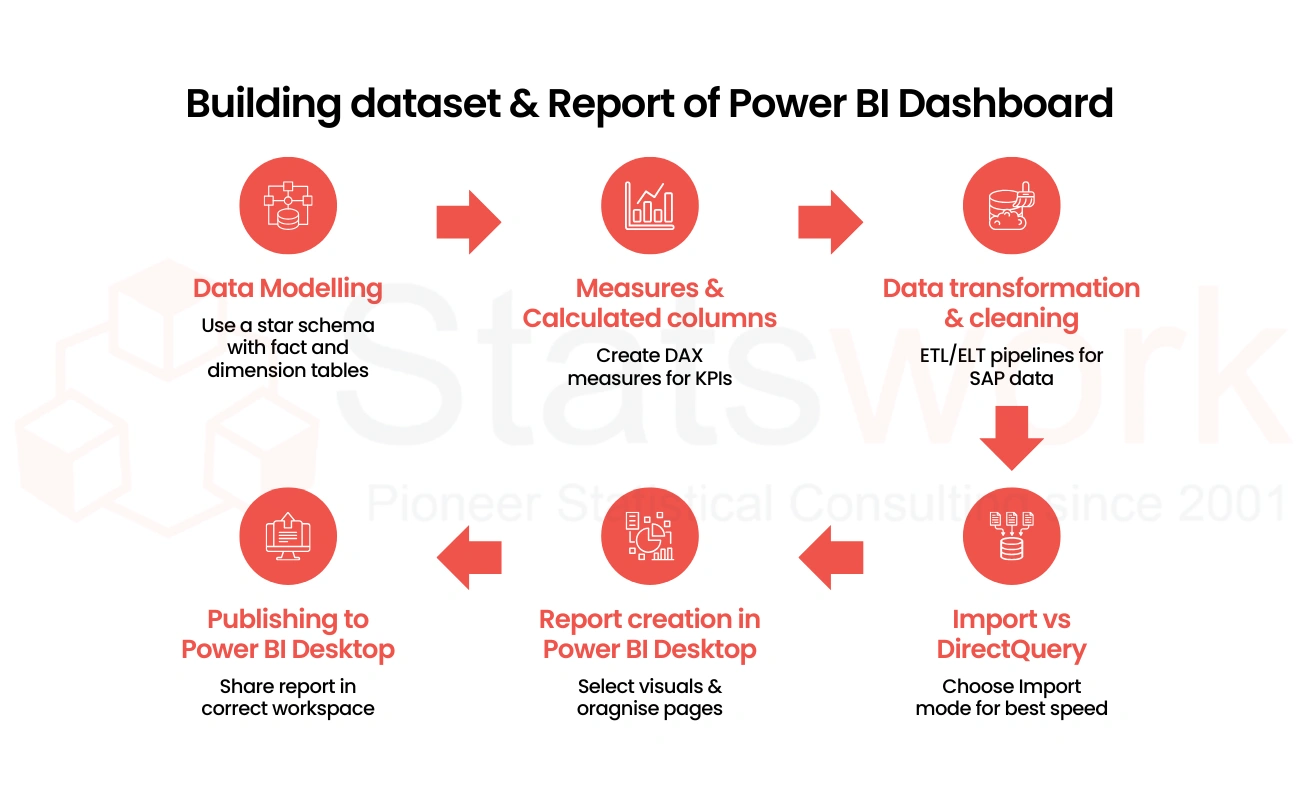
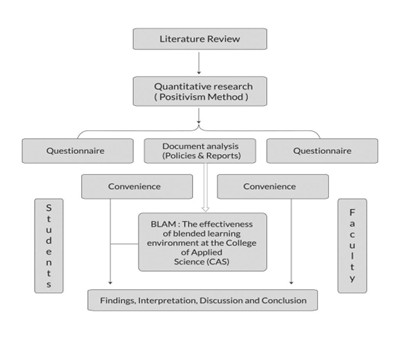
Figure1: Building Dataset and Report Workflow in Power BI Dashboard Development
Power BI Dashboard Design Templates for Report Creation
The use of Power BI dashboard design templates will assist organizations in accelerating their report creation process due to the ready-made designs and visuals.
Key Features of the Templates
- Cards/Metrics for key performance indicators
- Charts and graphs
- Filters/Slicers
- Tables/Matrixes
- Data summaries
- Responsive templates
Such templates are very helpful for quantitative research that requires standard report designs.
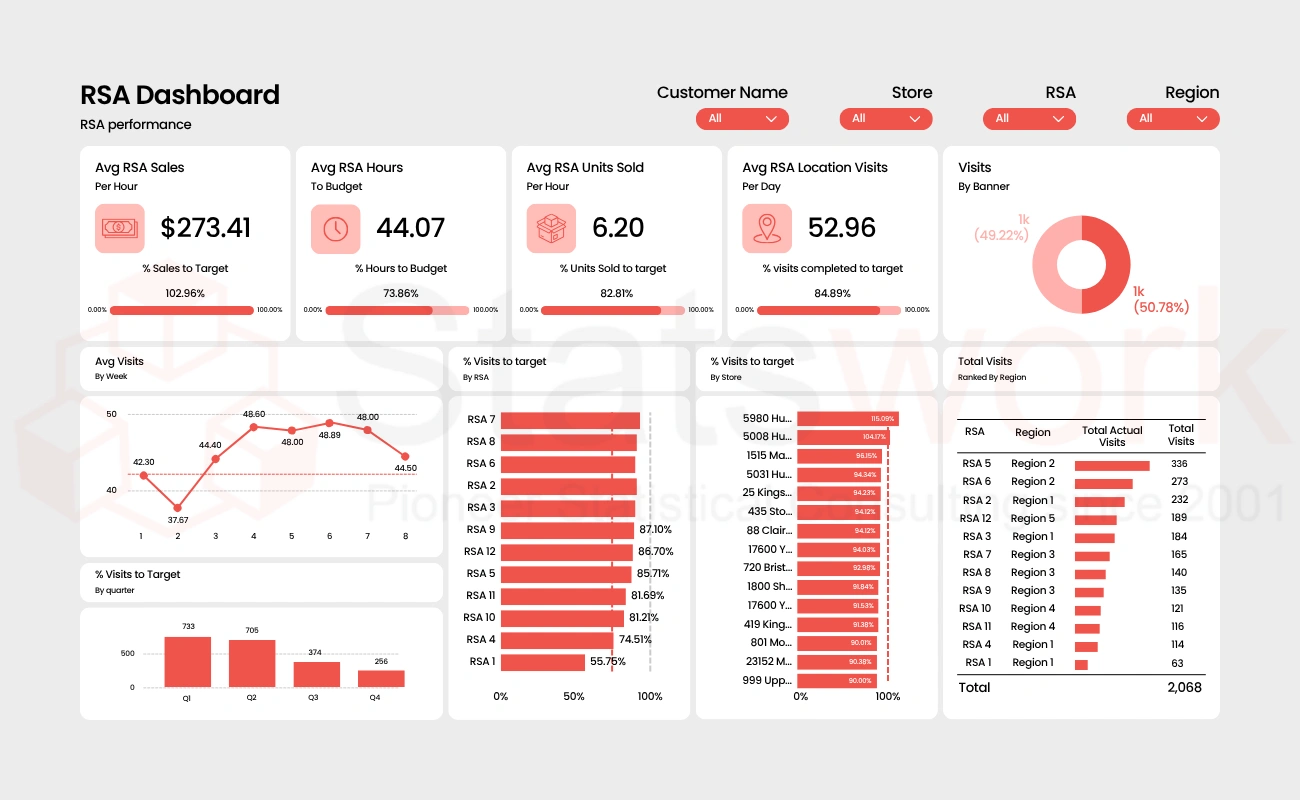
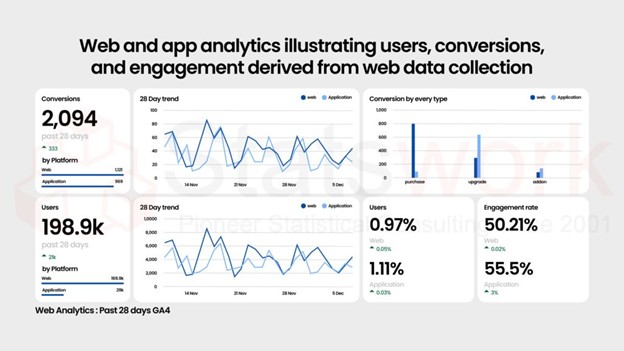
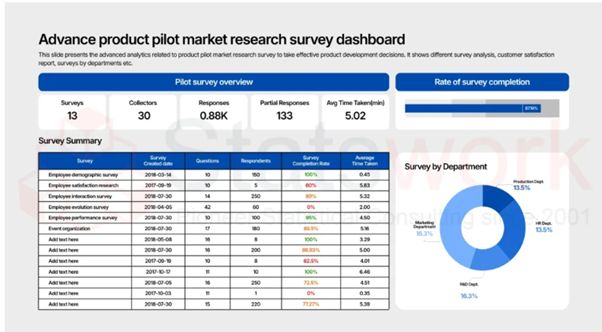
Figure 2: Example of an Interactive Power BI Dashboard for Quantitative Data Analysis and Reporting
Power BI Dashboard Design Best Practices for Research Analytics
Power BI dashboard design best practices center on designing secure, accurate, and easy-to-use dashboards in conducting quantitative research.
Important Dashboard Design Best Practices
| Best Practices | Purpose |
| Data Validation | Guarantees accuracy of secondary datasets |
| Access Control | Safeguards confidential research data |
| Responsive Design | Enhances usability for different devices |
| Dashboard Scalability | Manage large datasets effectively |
| Real-Time Updates | Provides up-to-date insights |
Organizations that follow the principles of designing Power BI dashboards will find improvements in the research process, efficiency, and decision-making skills.
The Future of Power BI Dashboard Development in Quantitative Research
Considering the adoption of data-driven business models, the need for developing dashboards through the Power BI system is likely to increase in the future. Advancements in artificial intelligence and predictive analytics have made it easy to develop more features within the Power BI system.
Some of the developments that will be seen in future Power BI dashboards are:
- Analytics based on artificial intelligence
- Predictive modeling
- Automated features
- NLP queries
- Real-time collaborative reports
The developments mentioned above will contribute greatly to the efficiency of Power BI dashboards in performing secondary quantitative data collection and business intelligence.
Conclusion
The Power BI dashboard development process is an efficient method of displaying complex data in a visual format. With Power BI advanced reporting features, custom templates, data analytics, and data visualization, accurate decisions and conclusions will be drawn from data analysis conducted by researchers.
Through Power BI dashboard development GitHub, Power BI dashboard development PDF tutorials, dashboard PBIX templates, and the best practices of Power BI dashboard development, it is possible to create high-quality dashboards.
At Statswork, expert-driven secondary quantitative data collection and Power BI dashboard development services are designed to help researchers and organizations streamline data analysis, reporting, and visualization. From custom dashboards to advanced business intelligence solutions, Statswork delivers scalable analytics services tailored to diverse research and business requirements.
References
- Singh, A. Kumar, J. Singh and J. Kaur, “Data Visualization for Developing Effective Performance Dashboard with Power BI,” 2023 International Conference on Innovative Data Communication Technologies and Application (ICIDCA), Uttarakhand, India, 2023, pp. 968-973, doi