- Services
- Data Analysis services
- Sample Work

Data Analysis services
- Secondary Qualitative Research Services
- Secondary Quantitative Research Services
- Meta-Analysis Research services
- Sample Work

Meta-Analysis Research Services
- Data Collection Services
- Sample Work

Data Collection Services
- Statistical & Biostatistics services
- Sample Work

Statistical Programming & Biostatistics services
- Data Management Services
- Sample Work

Data Management Services
- Research methodology services
- Sample Work

Research methodology services
- Tool Development Services
- Sample Work

Tool development services
- Statistical Interpretation services
-
Statistical Interpretation services
- Sample Work

Statistical Interpretation services
-
- Sample Size Calculation Services
-
Sample Size Calculation Services
- Sample Work

Sample Size Calculation Services
-
- AI & ML Services
-
Artificial Intelligence and Machine Learning Services
- Sample Work

Artificial Intelligence and Machine Learning Services
-
- Meaningful Visualization Services
- Thought Leadership Services
- Report Generation Services
-
Report generation Service
- Sample Work

Report generation Services
-
- Data Analysis services
- Industries
- About Us
- Blog
- Insights
- Contact Us
- Services
- Data Analysis services
- Sample Work
Data Analysis services
- Secondary Qualitative Research Services
- Secondary Quantitative Research Services
- Meta-Analysis Research services
- Sample Work
Meta-Analysis Research Services
- Data Collection Services
- Sample Work
Data Collection Services
- Statistical & Biostatistics services
- Sample Work
Statistical Programming & Biostatistics services
- Data Management Services
- Sample Work
Data Management Services
- Research methodology services
- Sample Work
Research methodology services
- Tool Development Services
- Sample Work
Tool development services
- Statistical Interpretation services
-
Statistical Interpretation services
- Sample Work
Statistical Interpretation services
-
- Sample Size Calculation Services
-
Sample Size Calculation Services
- Sample Work
Sample Size Calculation Services
-
- AI & ML Services
-
Artificial Intelligence and Machine Learning Services
- Sample Work
Artificial Intelligence and Machine Learning Services
-
- Meaningful Visualization Services
- Thought Leadership Services
- Report Generation Services
-
Report generation Service
- Sample Work
Report generation Services
-
- Data Analysis services
- Industries
- About Us
- Blog
- Insights
- Contact Us
The Role of Forest Plots in Meta-Analysis and Systematic Reviews
- Home
- Insights
- Article
- The Role of Forest Plots in Meta-Analysis and Systematic Reviews
Qualitative Research Service
- Introduction
- Major Components of a Forest Plot
- Why Forest Plots Are Essential in Meta-Analysis
- How to Interpret a Forest Plot in Meta-Analysis and Systematic Review
- Advantages of Using Forest Plots
- Limitations of Forest Plots in Meta-Analysis and Systematic Review
- Best Practices for Creating and Using Forest Plots
News & Trends
Recommended Reads
Contact us
- 1. Introduction
- 2. Major Components of a Forest Plot
- 3. Why Forest Plots Are Essential in Meta-Analysis
- 4. How to Interpret a Forest Plot in Meta-Analysis and Systematic Review
- 5. Advantages of Using Forest Plots
- 6. Limitations of Forest Plots in Meta-Analysis and Systematic Review
- 7. Best Practices for Creating and Using Forest Plots
Forest plots are one of the best-known and most fundamental tools in evidence-based research. Forest plots are graphical representations that can help anyone understand complex information drawn from different studies. As part of a meta-analysis or systematic review, a forest plot can be thought of as the medium through which raw data can be translated into results.
Introduction
Forest plot is one of the commonly used graphics in meta-analysis, where results of several studies are displayed in one place. The result of individual studies can be represented on the forest plot by means of the square and a line indicating confidence interval. In such a way, forest plot enables one to visually compare contributions of every study to the meta-analysis.
Additionally, results of all studies included in the forest plot are summed up to produce a pooled estimate, which can be shown in the form of a diamond on the chart. Forest plot is highly appreciated in medicine, sociology, and other spheres as it helps to organize by data visualization. [1]
Major Components of a Forest Plot
The forest plot structure is an integral aspect that one needs to know in order to understand the findings presented in the meta-analysis study. All parts have their particular importance in explaining how each study affects the overall findings.
| Component | Description |
| Study Names | Listed on the left side, which is used to identify all the studies used in the meta-analysis |
| Effect Size | The outcome of each study such as odds ratio or risk ratio |
| Confidence Interval | Displayed in the form of horizontal lines, reflecting uncertainty for each estimate of the studies |
| Weight of Study | Sized according to the contribution of each study in the combined effect |
| Central Line | The vertical line that marks zero effect, e.g. odds ratio equal to 1 |
| Summary Diamond | The overall pooled estimate from all the studies and its confidence interval [1] |
Why Forest Plots Are Essential in Meta-Analysis
Forest plots are essential when it comes to compiling information from various studies since they provide an opportunity to present complicated statistical data analysis in a concise graphical way. They allow one to see various aspects of a study without necessarily going through the numbers.
They can help to:
- See the results of different studies at a glance
- Determine the uniformity or variations in results from different studies
- Establish the degree and trend of evidence
- Identify any outliers
If not for the forest plot, understanding the result of the meta-analysis would be difficult without having to look through the numbers. [2]
How to Interpret a Forest Plot in Meta-Analysis and Systematic Review
Knowing how to read a forest plot is very essential when interpreting the outcome of a meta-analysis. All the graphical representations have significance, either statistical or otherwise, when it comes to the interpretation of findings.
- The vertical line in the centre represents the line of no effect, meaning that there was no difference between the two groups compared in the research.
- If confidence intervals cut across this line, then the finding of this study is not statistically significant.
- The square images depict the weights of each study; the bigger the square, the more influential its effect.
- Lastly, the diamond represents the overall pooled finding of all the studies considered. [3]
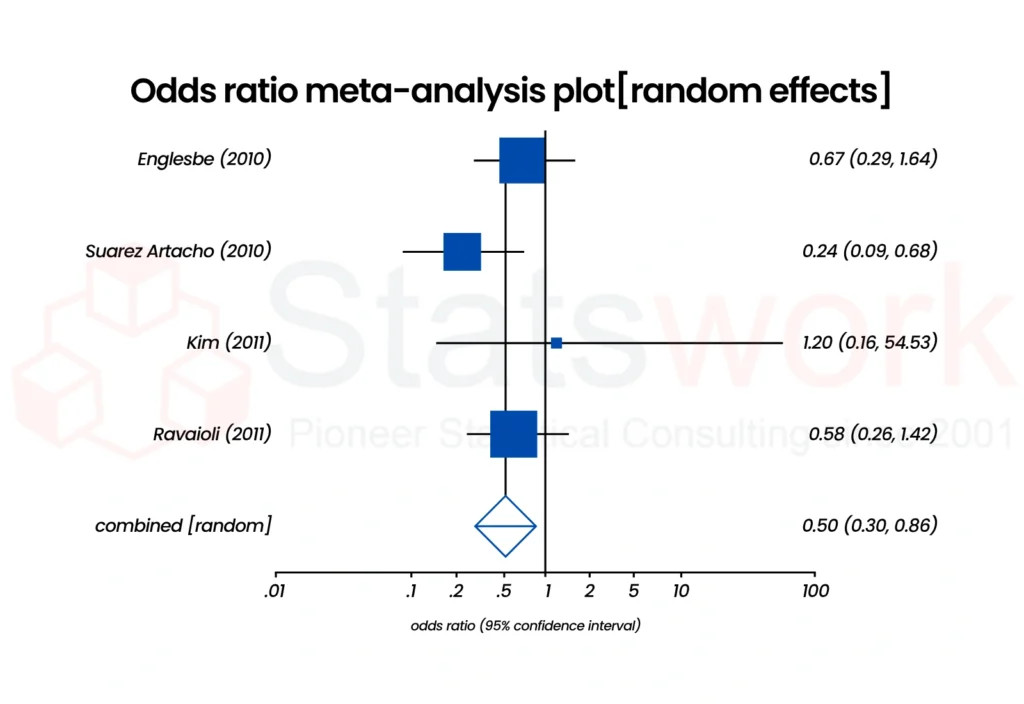
Fig 1 : shows A forest plot of study odds ratios with confidence intervals and a pooled effect estimate.
Advantages of Using Forest Plots
There are numerous advantages associated with the use of forest plots when conducting systematic reviews since the plot presents complicated data in an understandable manner. Forest plots ensure that researchers can comprehend the general trends from the complicated data presented.
- Clarity: Complicate data is represented in a simple graphical presentation
- Comparison: Comparison of different studies’ results at a glance through graphs
- Transparency: Presentation of individual results as well as the overall results in one graph
- Efficiency: Saves much time required for analysing vast amounts of data
So, there are numerous reasons why forest plots are indispensable in conducting systematic reviews. [4]
Limitations of Forest Plots in Meta-Analysis and Systematic Review
Forest plots are useful but come with some weaknesses:
| Limitation | Explanation |
| Oversimplification | They can conceal important details, which might give rise to an incomplete interpretation of the results |
| Misinterpretation | The need for some statistical know-how is mandatory; otherwise, interpreting the outcomes would prove difficult |
| Publication Bias Ignored | It cannot show how biases can be built into the study selection process, such as the exclusion of papers that had null results |
| Heterogeneity Complexity | The visual presentation of data might not adequately describe the amount of variability between each study’s outcomes [4] |
Best Practices for Creating and Using Forest Plots
The best way to achieve high effectiveness from the use of forest plots is by following certain best practices. Forest plots help in making the results clearer and contribute to high-quality meta-analysis.
- Apply consistent effect measures for all the selected studies
- Label the graph’s axes, scales, and studies for clear comprehension
- Plot the weight of evidence and confidence intervals
- Calculate heterogeneity statistics such as I-squared values
- Include only as many studies as needed, since over crowdedness may lower clarity
Furthermore, it is recommended to integrate the use of forest plots with other types of graphs such as funnel plots. [5]
Conclusion
Forest plots play a vital role in the realm of meta-analysis and systematic reviews since they provide a useful mechanism through which to visualize complex information. Forest plots allow researchers to compare various studies, identify consistencies, and make conclusions from a lot of data.
Though there are certain limitations associated with the use of forest plots, the strengths definitely overshadow the weaknesses, especially when one understands how to construct and interpret forest plots.
Understanding forest plots can enhance the quality of a systematic review because the reader will appreciate the information being provided.
Bring clarity and confidence to your research findings with expertly crafted forest plots from Statswork
Reference
- Li, G., Zeng, J., Tian, J., Levine, M. A., & Thabane, L. (2020). Multiple uses of forest plots in presenting analysis results in health research: a tutorial. Journal of clinical epidemiology, 117, 89-98. https://www.sciencedirect.com/
- Stephenson, J. (2017). Explaining the forest plot in meta-analyses. Journal of wound care, 26(11), 611-612. https://www.magonlinelibrary.com/
- Favorito, L. A. (Ed.). (2023). Systematic review and metanalysis in urology: how to interpret the forest plot. International braz j urol, 49(6), 775-778. https://www.scielo.br/j/ibju/a/6bGV
- Alavi, M., Hunt, G. E., Visentin, D. C., Watson, R., Thapa, D. K., & Cleary, M. (2021). Seeing the forest for the trees: How to interpret a meta-analysis forest plot. Journal of advanced nursing, 77(3), 1097-1101. https://elibrary.ru/item.asp?id=77855675
- Jonsson, E. N., & Nyberg, J. (2024). Using forest plots to interpret covariate effects in pharmacometric models. CPT: Pharmacometrics & systems pharmacology, 13(5), 743-758. https://ascpt.onlinelibrary.wiley.com/