
- Services
- Data Analysis services
- Sample Work
Data Analysis services
- Secondary Qualitative Research Services
- Secondary Quantitative Research Services
- Meta-Analysis Research services
- Sample Work
Meta-Analysis Research Services
- Data Collection Services
- Sample Work
Data Collection Services
- Statistical & Biostatistics services
- Sample Work
Statistical Programming & Biostatistics services
- Data Management Services
- Sample Work
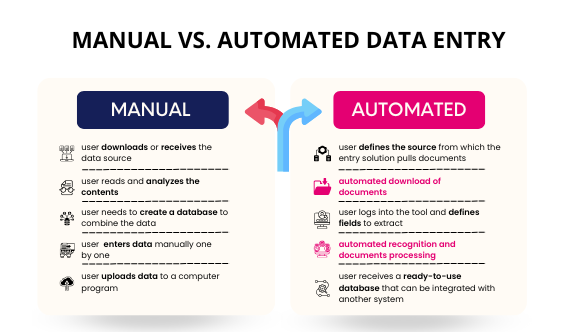
Data Management Services
- Research methodology services
- Sample Work
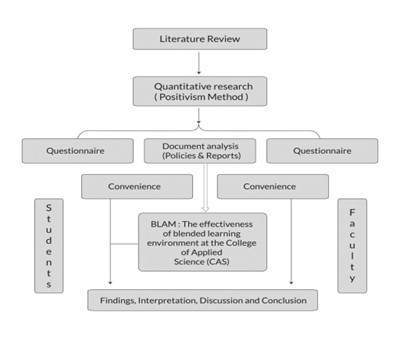
Research methodology services
- Tool Development Services
- Sample Work
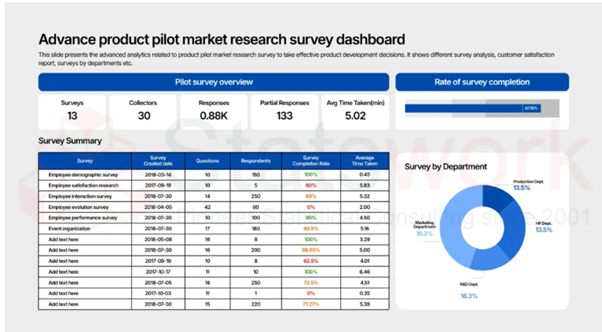
Tool development services
- Statistical Interpretation services
-
Statistical Interpretation services
- Sample Work
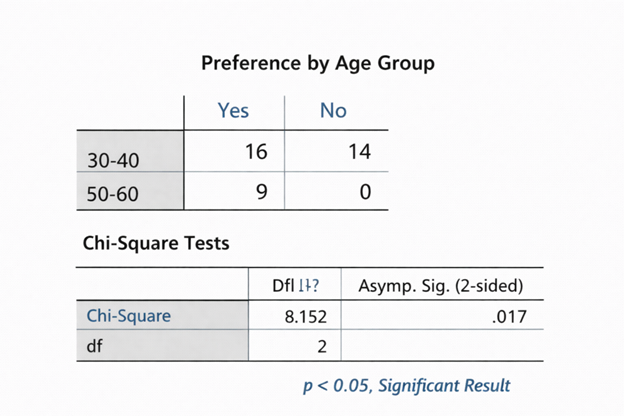
Statistical Interpretation services
-
- Sample Size Calculation Services
-
Sample Size Calculation Services
- Sample Work
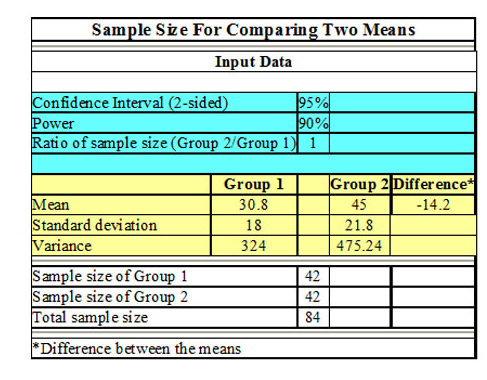
Sample Size Calculation Services
-
- AI & ML Services
-
Artificial Intelligence and Machine Learning Services
- Sample Work
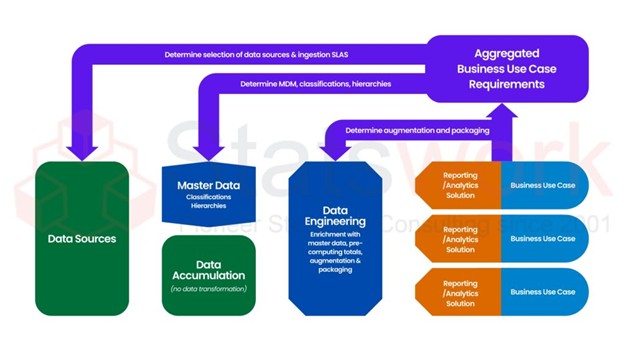
Artificial Intelligence and Machine Learning Services
-
- Meaningful Visualization Services
- Thought Leadership Services
- Report Generation Services
-
Report generation Service
- Sample Work
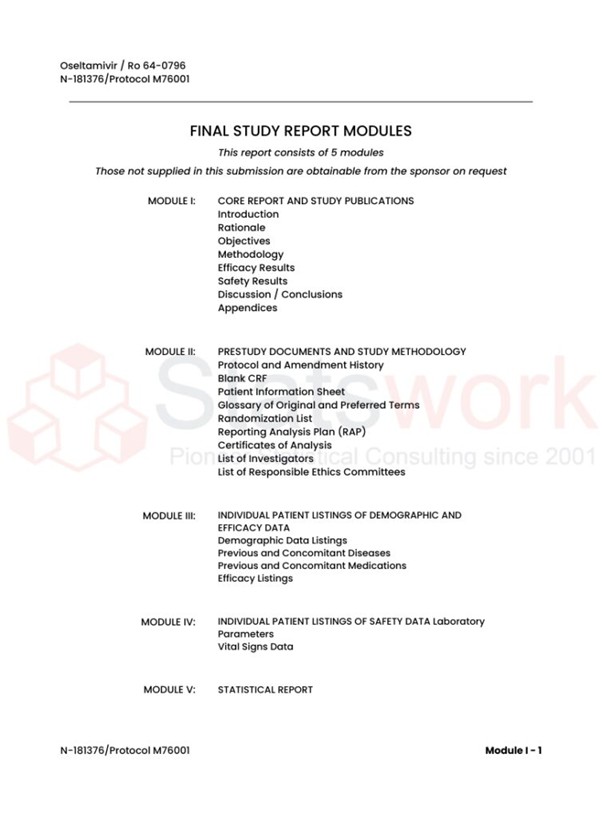
Report generation Services
-
- Data Analysis services
- Industries
- About Us
- Blog
- Insights
- Contact Us
- Services
- Data Analysis services
- Sample Work
Data Analysis services
- Secondary Qualitative Research Services
- Secondary Quantitative Research Services
- Meta-Analysis Research services
- Sample Work
Meta-Analysis Research Services
- Data Collection Services
- Sample Work
Data Collection Services
- Statistical & Biostatistics services
- Sample Work
Statistical Programming & Biostatistics services
- Data Management Services
- Sample Work
Data Management Services
- Research methodology services
- Sample Work
Research methodology services
- Tool Development Services
- Sample Work
Tool development services
- Statistical Interpretation services
-
Statistical Interpretation services
- Sample Work
Statistical Interpretation services
-
- Sample Size Calculation Services
-
Sample Size Calculation Services
- Sample Work
Sample Size Calculation Services
-
- AI & ML Services
-
Artificial Intelligence and Machine Learning Services
- Sample Work
Artificial Intelligence and Machine Learning Services
-
- Meaningful Visualization Services
- Thought Leadership Services
- Report Generation Services
-
Report generation Service
- Sample Work
Report generation Services
-
- Data Analysis services
- Industries
- About Us
- Blog
- Insights
- Contact Us
Data Interpretation Services: Turning Analytics into Business Value
Qualitative Research Service
News & Trends
Recommended Reads
Contact us
Summary:
In this article, you will learn about the process of turning data interpretation service into valuable information by relating the statistics to business aims such as revenue increase and customer loyalty. You will read about six kinds of interpretation (descriptive, diagnostic, predictive, prescriptive, and qualitative), the data interpretation process (data collection, cleaning, analysis, visualization, and reporting), and some popular tools (SPSS, Python, Power BI, and SQL). In addition, you will know about industries that use the service (healthcare, financial, retail, manufacturing, research, marketing), common problems (inadequate data quality, bias, data overload) and the solution to each of them, and best practices for accurate interpretation. You will also find out that data interpretation is crucial for modern business, and Statswork is an interpretation service provider.
In the current era of data-centric economy, organizations produce huge amounts of information every day. However, all the numbers, graphs, charts, and dashboards become meaningless without proper interpretation [1]. Data interpretation services provide just such an interpretation turning large sets of complicated data into business insights.
Data interpretation is not simply working with numbers. It is a way for a company to interpret data and draw useful conclusions from the results obtained.

What Are Data Interpretation Services?
Interpretation of data services include examining processed data for patterns and trends and making conclusions from the statistics for the purpose of offering useful business advice. While data analysis simply entails the use of statistics, data interpretation is all about making sense of these statistics by relating them to the objectives of a company.
For instance, the goals may be revenue generation and retention of customers [2].
Why Data Interpretation Matters Business Growth
Organizations that put effort into analyzing data by experts always beat other firms that make decisions based on instincts alone. Some of the advantages are:
- Enhanced decision making by basing decisions on facts and not on assumptions.
- Quick recognition of trends in the market as well as new behavioral patterns among customers.
- Decreased risks through quick recognition of anomalies and inefficiencies.
- Better return on investment on data because raw data is transformed into strategy.
Types of Data Interpretation Methods
| Method | Purpose | Business Question Answered |
| Descriptive Interpretation | Summarizes historical data | What happened? |
| Diagnostic Interpretation | Identifies root causes | Why did it happen? |
| Predictive Interpretation | Forecasts future outcomes | What is likely to happen? |
| Prescriptive Interpretation | Recommends action plans | What should we do next? |
| Qualitative Interpretation | Analyzes non-numerical data (feedback, surveys) | How do customers feel? |
Each method plays a distinct role in the overall analytics lifecycle, and most organizations use a combination of these approaches to build a complete picture of business performance [3].
The Data Interpretation Process
Consistency is essential when doing the analysis. In most cases, firms that conduct data analytics do so following the pattern illustrated below.
- Data collection and verification – Data collection from different sources and verification of the data
- Data cleansing – Eliminating duplication and errors in data
- Statistical analysis – Statistical analysis of the collected data
- Trends identification – Trend identification of the collected data
- Data visualization – Representation of data analysis in graphical forms among others
- Reporting – Decision making based on the data analysis [4]
Tools and Techniques Used in Data Interpretation
| Category | Common Tools |
| Statistical Analysis | SPSS, SAS, R, Python |
| Data Visualization | Power BI, Tableau, Excel |
| Database Management | SQL, MySQL, Oracle |
| Cloud & Big Data | AWS, Azure, Google Cloud |
| Qualitative Analysis | NVivo, thematic coding frameworks |
Choosing the right combination of tools depends on data volume, industry requirements, and the complexity of the business question being addressed.
Industries That Rely on Data Interpretation Services
- Healthcare — Clinical trial analysis, patient outcome trends, and epidemiological research
- Finance — Risk assessment, fraud detection, and investment forecasting
- Retail & E-commerce — Customer behavior analysis and demand forecasting
- Manufacturing — Process optimization and quality control analytics
- Academic Research — Survey analysis, hypothesis testing, and thesis data interpretation [3]
- Marketing — Campaign performance measurement and audience segmentation
Common Challenges in Data Interpretation
| Challenge | Impact | Solution |
| Poor data quality | Misleading conclusions | Rigorous data cleaning and validation |
| Lack of statistical expertise | Incorrect model selection | Partnering with experienced analysts |
| Data overload | Analysis paralysis | Clear objective-driven analysis frameworks |
| Bias in interpretation | Flawed business decisions | Peer review and standardized methodologies |
| Inconsistent reporting | Poor stakeholder communication | Standardized visualization templates |
Best Practices for Accurate Data Interpretation
Always specify the question or problem being researched before carrying out any analysis.
- Use the appropriate statistical tests or models according to the nature of the data
- Validate the results using different data sources
- Visualize results in an understandable way to non-statisticians
- Clearly state assumptions and limitations of the study
- Validate the model against actual performance regularly [3]
Conclusion
Interpretation services for data have ceased to be a luxury but a necessity in the modern age where information abounds. The organizations which can correctly interpret their data have an undeniable advantage over their competitors in making informed decisions regarding risks and strategies [4]. It does not matter whether the area of study is healthcare data, financial data, or any other form of data.
It is with this in mind that Statswork provides top-notch data interpretation services to businesses, researchers, and academic professionals who require such assistance.
Frequently asked question:
Data analytics creates value for businesses by transforming raw data into actionable insights that improve decision-making, optimize operations, enhance customer experiences, reduce risks, and identify new growth opportunities.
Data interpretation is used in business to analyze statistical results, identify trends and patterns, evaluate performance, and support strategic decisions that align with organizational goals.
The four stages of business analytics are descriptive analytics, which explain what happened; diagnostic analytics, which identifies why it happened; predictive analytics, which forecasts what is likely to happen; and prescriptive analytics, which recommends the best course of action.
Interpretation in business analytics is the process of explaining analytical results and translating them into meaningful insights that help organizations make informed business decisions.
The four main types of interpretation are descriptive interpretation, diagnostic interpretation, predictive interpretation, and prescriptive interpretation, each providing different levels of insight for business decision-making.
R is better than Excel for handling large datasets, advanced statistical analysis, automation, and reproducible research, while Excel is more suitable for simple calculations and basic data management.
Reference
- Arora, D., & Malik, P. (2015, March). Analytics: Key to go from generating big data to deriving business value. In 2015 IEEE first international conference on big data computing service and applications(pp. 446-452). IEEE. https://ieeexplore.ieee.org/abstract
- Bose, R. (2009). Advanced analytics: opportunities and challenges. Industrial Management & Data Systems, 109(2), 155-172. https://www.emerald.com/imds/article
- Mikalef, P., Pappas, I. O., Krogstie, J., & Giannakos, M. (2018). Big data analytics capabilities: a systematic literature review and research agenda. Information systems and e-business management, 16(3), 547-578. https://link.springer.com/article/10.1007
- Sharma, R., Mithas, S., & Kankanhalli, A. (2014). Transforming decision-making processes: a research agenda for understanding the impact of business analytics on organisations. European Journal of Information Systems, 23(4), 433-441. https://www.tandfonline.com/doi/full