Significance of Big data analytics in the healthcare industry
August 9, 2021
Statistical analysis using the Fuzzy approach
August 11, 2021Standard Statistical Tools in Research and Data Analysis
Meta Analysis Service
- Standard Statistical Tools in Research and Data Analysis for Better Decision Making
- Why Statistical Analysis Matters
- Essential Statistical Techniques Used in Research and Business
- Statistical Software for Research and Business Analytics
- Applications Across Industries
- Why Companies Outsource Their Statistical Analysis
- Conclusion
Recommended Reads
Contact us
Summary:
Statistical analysis makes use of various tools that enable decision-makers to derive useful information from data. Various techniques include descriptive statistics, inferential statistics, regression analysis, ANOVA, and hypothesis testing, among others. Statswork Data Analysis Services is a leading provider of statistical modeling, research methods, survey data analysis, and business analytics services.
Standard Statistical Tools in Research and Data Analysis for Better Decision Making
Statistics are widely applied by both organisations and researchers because of the way things have become in today’s world, where everything revolves around data. Organisations use statistics for analysing their performance, while researchers use them for conducting studies. Market researchers also use statistics through the use of various tools and techniques. Modern organisations have begun adopting the use of data analysis tools and techniques in business and business intelligence statistics tools [1].
Why Statistical Analysis Matters
Statistical analysis allows companies to analyse data, assess results, and make their decision-making process better. Companies employ analytics to track the results, predict trends, and optimise operations, whereas researchers use statistical tools to prove their results and test the theories. Using corporate data analysis services will allow the organisation to analyse complex data sets and get valuable information from them.
Some advantages of statistical analysis are as follows:
- Increased business intelligence and reports
- Accurate measurement of KPI and performance
- Market research analysis
- Forecasting and risk analysis
- Research results based on evidence
- Better decision making [2]
Essential Statistical Techniques Used in Research and Business
Descriptive Statistics
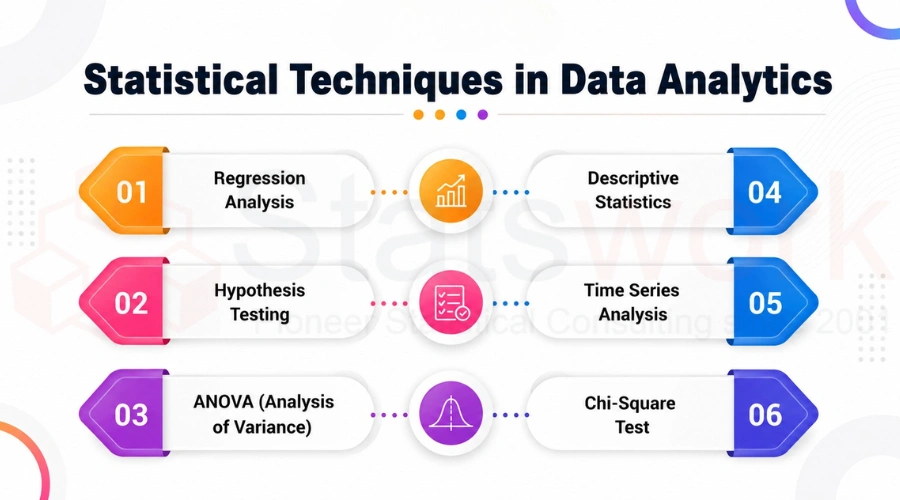
Descriptive statistics describe data in an organized way. Such measures as mean, median, mode, percentages, and standard deviation aid both researchers and businesspeople in having a clear understanding of the data being handled. Descriptive statistics is often applied in corporate reporting, customer analysis, and performance appraisal by businesses.
Inferential Statistics
Whereas descriptive statistics describe current data, inferential statistics aid in drawing conclusions from sample data regarding populations. Through the application of inferential statistics, organisations are able to predict and make estimates [3].
Hypothesis Testing and P-Value Interpretation
Hypothesis testing is a statistical tool utilized for determining the statistical significance of results. P-value interpretation can be performed as a part of the hypothesis testing procedure to either accept or reject the hypothesis. It is widely utilized in medical, marketing and business research.
T-Test and ANOVA
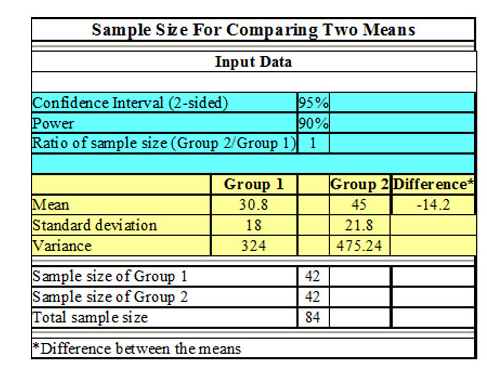
A t-test measures the difference between means of two samples whereas ANOVA (analysis of variance) measures the differences among means of three or more groups. Such tests are widely utilized in product testing, satisfaction analysis of customers or employees, experiments.
Correlation and Regression Analysis
Correlation analysis measures the relationship between variables allowing to understand how one variable affects another. Regression analysis allows predicting future outcomes and understanding the drivers of business performance. These analytical tools are widely used for sales analysis, forecasting, financial planning, consumer behaviour study [4].
Chi-Square Test and Factor Analysis
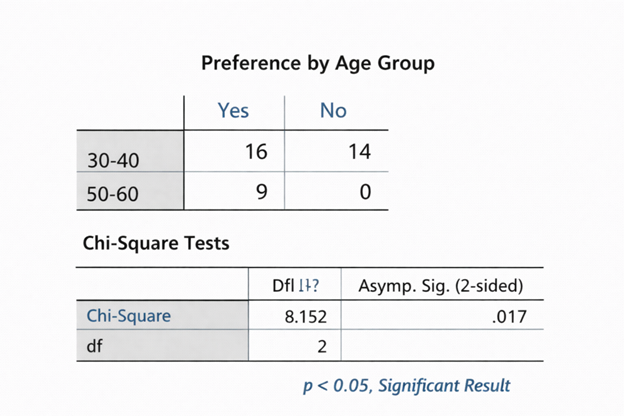
Chi-Square test is mostly used for measuring the relationship between categorical variables; it may be useful for analysing surveys and market research data. Factor analysis allows revealing the patterns within huge data sets; it is mostly used in customer satisfaction surveys and brand perception studies [3].
Statistical Software for Research and Business Analytics
It is vital to choose the appropriate statistical analysis software to be able to get proper results in a research work. There is a great number of software tools that can be used in academic research as well as business purposes.
|
Software Tool |
Applications |
|
SPSS Software |
Academic and social research |
|
SAS Analytics |
Enterprise data analysis |
|
R Programming |
Statistical Modelling |
|
Python Statsmodels |
Predictive analytics and automation |
|
Stata Econometrics |
Economic research |
These platforms help organisations streamline analysis, improve reporting accuracy, and support evidence-based decision making.
Applications Across Industries
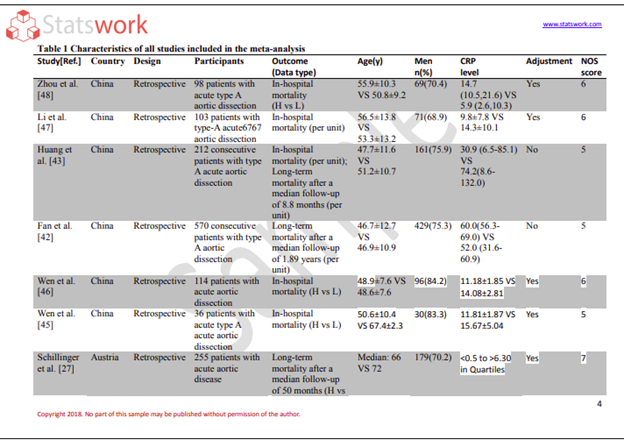
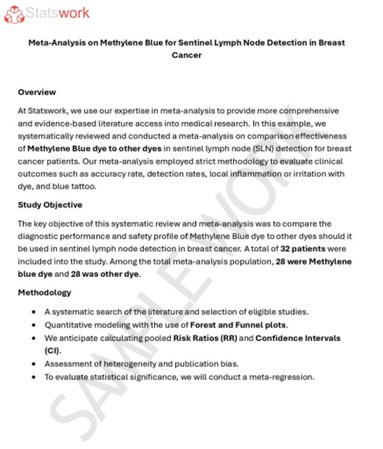
Statistics play a very crucial role in various industries. Analytics are used by businesses for conducting market research analysis, customer segmentation, and evaluation of their performance. Statisticians work in the health sector to provide clinical trial statistics, biostatistics consulting, and epidemiology study design. Statistics is also very important for academic researchers in using quantitative research methods for business, quantitative research design, determination of sample size, and research methodology. Furthermore, complex tools such as systematic review and meta-analysis can be used to combine data obtained from various studies [4].
Why Companies Outsource Their Statistical Analysis
There are a number of companies and organisations that decide to hire experts to carry out the statistical analysis since they need special expertise and methodologies. Some of the services provided by professional statisticians include survey analysis, predictive modelling, business intelligence, and research consulting. Apart from the cost efficiency of outsourcing, the benefits include the provision of quality results, prompt delivery, and compliance with research criteria, including IRB approval criteria.
Conclusion
Despite technological advancements, statistical techniques continue to be extremely important in making data useful and providing insight that contributes to business success and research excellence. The use of statistical techniques such as descriptive statistics, inferential statistics, regression analysis, ANOVA and hypothesis testing, to the advanced levels of application in enterprise data analysis and business intelligence, enables an organisation to base its decisions on information and evidence [3]. Statswork Data Analysis Services offer professional assistance in statistical modelling, analysis of survey data, research methodology, quantitative research, clinical trial statistics, and business analytics.
Frequently Asked Questions (FAQs)
Standard statistical tools are methods and software used to collect, analyze, and interpret data. Common tools include SPSS, SAS, R, Python, Excel, and Stata along with techniques like regression, ANOVA, and hypothesis testing.
SPSS is easier for beginners and widely used in social sciences, while Stata is more powerful for econometrics and advanced statistical modeling. The better choice depends on your research needs.
Basic statistical tools include mean, median, mode, standard deviation, variance, charts, graphs, and simple tests like t-test and chi-square test.
The 7 main types are:
Descriptive analysis , Inferential analysis , Predictive analysis , Prescriptive analysis , Exploratory analysis , Causal analysis , Mechanistic analysis
SAS is stronger for large-scale enterprise data and advanced analytics, while SPSS is easier for academic research and beginners. SAS is preferred in corporate environments.
References:
- Ali, Z., & Bhaskar, S. B. (2016). Basic statistical tools in research and data analysis. Indian journal of anaesthesia, 60(9), 662-669.https://journals.lww.com/ijaweb/fulltext/2016/60090/basic_statistical_tools_in_research_and_data.10.aspx
- Belouafa, S., Habti, F., Benhar, S., Belafkih, B., Tayane, S., Hamdouch, S., … & Abourriche, A. (2017). Statistical tools and approaches to validate analytical methods: methodology and practical examples. International Journal of Metrology and Quality Engineering, 8, 9.https://www.metrology-journal.org/articles/ijmqe/abs/2017/01/ijmqe160046/ijmqe160046.html
- Erceg-Hurn, D. M., & Mirosevich, V. M. (2008). Modern robust statistical methods: an easy way to maximize the accuracy and power of your research. American Psychologist, 63(7), 591.https://psycnet.apa.org/record/2008-14338-002
- Sarmento, R. P., & Costa, V. (2019). An overview of statistical data analysis. arXiv preprint arXiv:1908.07390.https://arxiv.org/abs/1908.07390
Contact us

Related posts