
- Services
- Data Analysis services
- Sample Work
Data Analysis services
- Secondary Qualitative Research Services
- Secondary Quantitative Research Services
- Meta-Analysis Research services
- Sample Work
Meta-Analysis Research Services
- Data Collection Services
- Sample Work
Data Collection Services
- Statistical & Biostatistics services
- Sample Work
Statistical Programming & Biostatistics services
- Data Management Services
- Sample Work
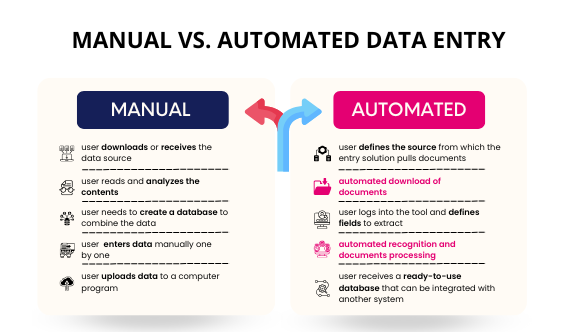
Data Management Services
- Research methodology services
- Sample Work
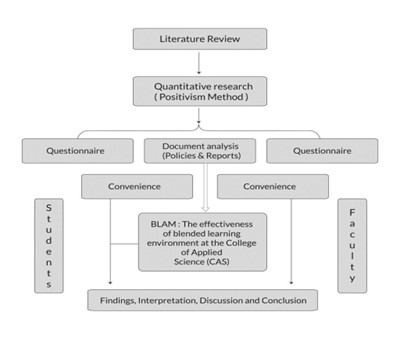
Research methodology services
- Tool Development Services
- Sample Work
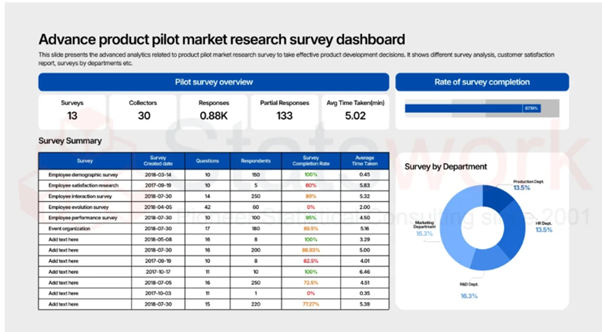
Tool development services
- Statistical Interpretation services
-
Statistical Interpretation services
- Sample Work
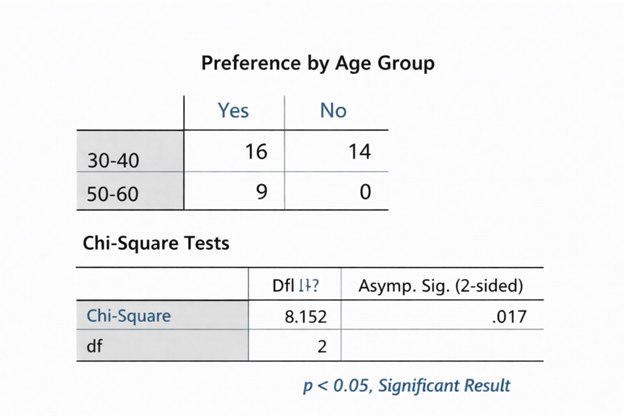
Statistical Interpretation services
-
- Sample Size Calculation Services
-
Sample Size Calculation Services
- Sample Work
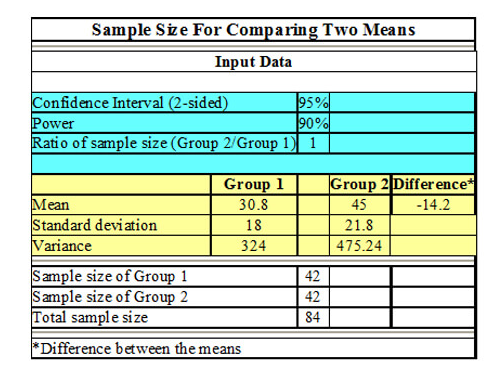
Sample Size Calculation Services
-
- AI & ML Services
-
Artificial Intelligence and Machine Learning Services
- Sample Work
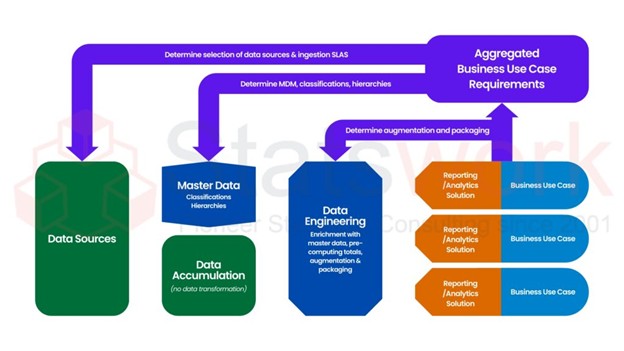
Artificial Intelligence and Machine Learning Services
-
- Meaningful Visualization Services
- Thought Leadership Services
- Report Generation Services
-
Report generation Service
- Sample Work
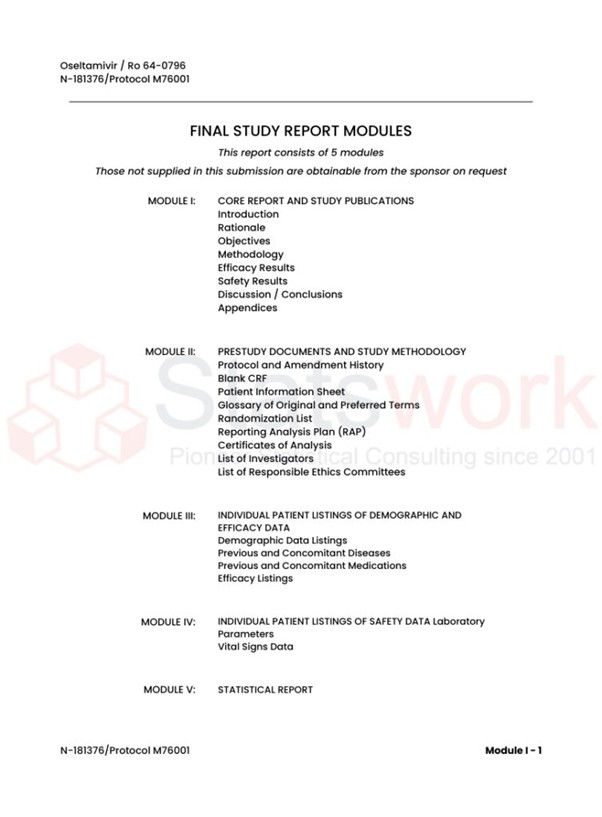
Report generation Services
-
- Data Analysis services
- Industries
- About Us
- Blog
- Insights
- Contact Us
- Services
- Data Analysis services
- Sample Work
Data Analysis services
- Secondary Qualitative Research Services
- Secondary Quantitative Research Services
- Meta-Analysis Research services
- Sample Work
Meta-Analysis Research Services
- Data Collection Services
- Sample Work
Data Collection Services
- Statistical & Biostatistics services
- Sample Work
Statistical Programming & Biostatistics services
- Data Management Services
- Sample Work
Data Management Services
- Research methodology services
- Sample Work
Research methodology services
- Tool Development Services
- Sample Work
Tool development services
- Statistical Interpretation services
-
Statistical Interpretation services
- Sample Work
Statistical Interpretation services
-
- Sample Size Calculation Services
-
Sample Size Calculation Services
- Sample Work
Sample Size Calculation Services
-
- AI & ML Services
-
Artificial Intelligence and Machine Learning Services
- Sample Work
Artificial Intelligence and Machine Learning Services
-
- Meaningful Visualization Services
- Thought Leadership Services
- Report Generation Services
-
Report generation Service
- Sample Work
Report generation Services
-
- Data Analysis services
- Industries
- About Us
- Blog
- Insights
- Contact Us
Approaching data analysis: How to interpret data? – Beginners Guide
Meta Analysis Service
- How to Analyze and Interpret Data: A Beginner’s Guide
- What Beginners Should Know First
- A practical data-analysis workflow typically involves three broad stages:
- Descriptive Statistics vs. Inferential Statistics
- What Should You Check Before Interpreting Statistical Results?
- Understanding Data Interpretation
- Build Your Data Skills With Expert Support
Recommended Reads
Contact us
Summary:
This introductory guide will assist you in understanding how you should analyze and interpret data to ensure that your decision-making is grounded on facts. This blog post touches upon some of the basic aspects related to data analysis, which include data processing, statistical information, and tools used for data analysis. The main aspects explained here include the concept of qualitative and quantitative data analysis and the difference between descriptive and inferential statistics.
How to Analyze and Interpret Data: A Beginner’s Guide
As organizations generate and collect more data, the ability to analyze and interpret that information accurately has become increasingly important for research and business decision-making. Numbers do not provide meaningful conclusions on their own. Data must be appropriately prepared, analyzed, interpreted, and considered in the context of the research or business question. This introductory guide provides a practical approach to analyzing and interpreting data so that research and business decisions are supported by appropriate evidence, statistical reasoning, and context.
Beginners analyzing research data should develop three core capabilities: statistical knowledge, sound data-processing skills, and familiarity with appropriate analytical and visualization tools [1].
What Beginners Should Know First
Before analyzing a dataset, clarify what the analysis is intended to answer and how the findings will be used. Data analysis and interpretation can help with:
- Describing and summarizing masses of information
- Evaluating and enhancing the quality of data
- Segmenting one big problem into smaller pieces
- Establishing dependencies between different variables, like spending and income
- Comparing findings in relation to different groups, regions or periods of time
- Distinguishing different kinds of variables (ordinal, nominal, categorical)
- Assessing whether a finding is practically meaningful in addition to evaluating statistical evidence
- Using appropriate analytical or predictive models to estimate future outcomes when the data, model assumptions, and study design support prediction [2]
Data Analysis in Research: The Basics
Research data analysis helps structure findings from surveys and studies so a researcher can reach a defensible conclusion. Its purpose is to address the research question using an analytical approach appropriate to the study design, data structure, variables, and assumptions.
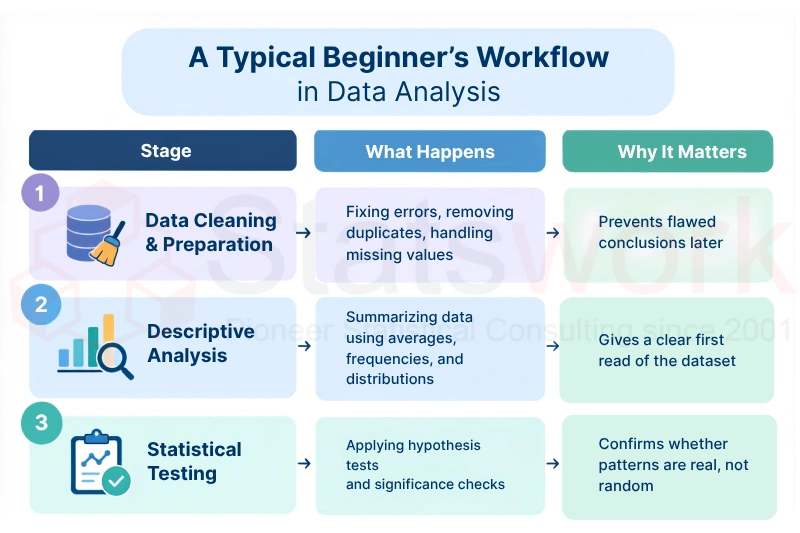
A practical data-analysis workflow typically involves three broad stages:
- Prepare the Data – Clean, validate, code, and assess missing, duplicate, or inconsistent values.
- Analyze the Data – Select and apply an analytical method appropriate to the research question, data type, study design, and assumptions.
- Interpret and Communicate Results – Evaluate the findings, uncertainty, practical significance, limitations, and implications before drawing conclusions.
Quantitative vs. Qualitative Data Analysis
Researchers may work with qualitative data, quantitative data, or both, depending on the research question and study design.
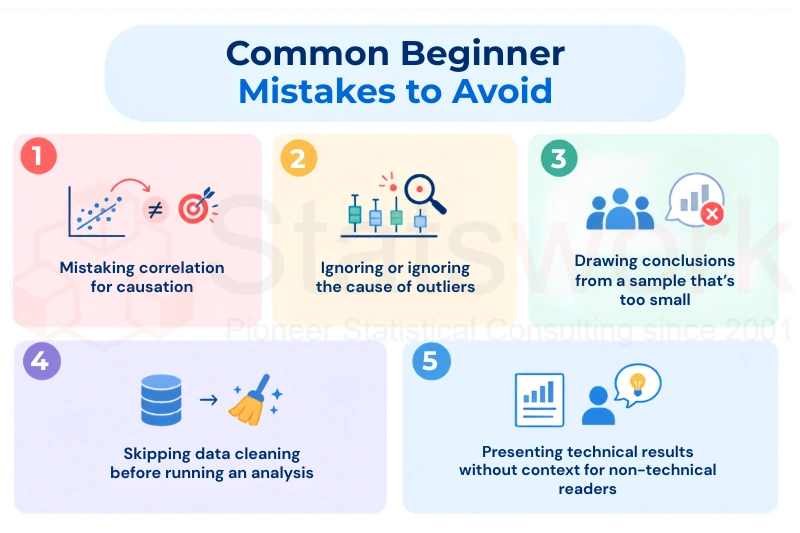
- Qualitative data analysis may involve interviews, focus groups, open-ended survey responses, observations, documents, or other non-numerical data. The analysis commonly focuses on identifying patterns, themes, categories, and meanings within the data.
- Quantitative data analysis uses statistical methods to summarize numerical data, examine differences or relationships, estimate uncertainty, and answer defined research or business questions. The appropriate method depends on the research objective, variable types, study design, data structure, and relevant statistical assumptions [3].
- Some business and academic studies combine quantitative and qualitative approaches when both numerical evidence and contextual understanding are relevant to the research question. Quantitative findings can describe patterns or relationships, while qualitative evidence can provide context for participants’ experiences, perceptions, or reasons
Descriptive Statistics vs. Inferential Statistics
| Aspect | Descriptive Statistics |
Inferential Statistics |
|---|---|---|
| Objective | Summarizes and describes the observed dataset | Uses sample data to estimate or test population-level characteristics, subject to the study design and statistical assumptions |
| Examples |
Measures of central tendency, measures of variability, frequency distributions, and graphs |
Confidence intervals, hypothesis tests, regression, and other statistical models used for inference |
| Best Suited For | Describing observed patterns, distributions, and characteristics of the available data | Evaluating evidence about relationships, differences, or population parameters beyond the observed sample |
What Should You Check Before Interpreting Statistical Results?
Statistical results should not be interpreted in isolation. Before drawing a conclusion, consider:
- Research Question: Does the selected analysis directly address the question being asked?
- Data Quality: Have missing values, duplicates, coding errors, and unusual observations been assessed appropriately?
- Statistical Method: Is the selected method suitable for the data, study design, and research objective?
- Assumptions: Have the relevant assumptions of the selected method been assessed?
- Effect Size: How large is the observed difference or relationship, rather than only whether it is statistically significant?
- Confidence Intervals: What range of values is compatible with the data and statistical model?
- Statistical Significance: If hypothesis testing is appropriate, what does the p-value indicate under the specified model and null hypothesis? Statistical significance does not automatically indicate practical importance.
- Confounding and Study Design: Could another variable or feature of the study design explain the observed relationship?
- Practical Meaning: What does the result mean for the research question, business problem, or decision?
- Limitations: What conclusions cannot be supported by the available data or study design?
The key principle is to interpret statistical results in the context of the method, uncertainty, study design, and practical objective—not as isolated numbers.
Understanding Data Interpretation
Data interpretation is an important part of a research report because analytical results must be evaluated in relation to the research question, study design, uncertainty, and subject-matter context.. It is a means of understanding data, since figures by themselves do not convey any relevant information to an individual making decisions. The interpretation of a dataset should be guided by the research question, study design, analytical method, statistical assumptions, uncertainty, and subject-matter context. Different analytical choices can lead to different conclusions, so interpretation should be transparent and evidence-based [2].
People who want to develop good data interpretation services must concentrate on:
- Mathematical and logical reasoning
- The capacity to look at the bigger picture
- The comfort level with numerical as well as non-numerical data
- Basic understanding of visualization tools
- Relevant subject-matter knowledge to interpret findings in context
Example: Interpreting a Business Data Finding
Suppose a company compares customer satisfaction scores before and after a service improvement. The analysis shows that the average satisfaction score increased after the change.
- Analysis: Descriptive statistics can summarize the observed change. An appropriate inferential method may then be selected based on the study design, measurement scale, independence of observations, and relevant statistical assumptions.
- Interpretation: A confidence interval can communicate uncertainty around the estimated difference. A p-value, when hypothesis testing is appropriate, evaluates compatibility of the observed data with a specified null hypothesis; it does not measure the size or practical importance of the effect.
- Decision: The business should consider the magnitude and uncertainty of the change alongside operational context before deciding whether the service improvement should be expanded.
- Important: An increase after an intervention does not, by itself, establish that the intervention caused the increase. Alternative explanations and the study design must be considered before making a causal claim.
When to Get Expert Support
Every team does not have the internal resources to conduct all stages of data analysis from start to finish. Corporate and research teams often go for outsourcing data analysis services or data analysis consultancy services for the sake of saving time, minimizing errors, and ensuring that they don’t misinterpret the findings of their study.
Build Your Data Skills With Expert Support
Learning to analyse and interpret data takes time, and complex datasets may require specialized statistical expertise. Statswork supports researchers and corporate teams across the data-analysis workflow—from data review, cleaning, and validation to statistical analysis, visualization, interpretation, and reporting. Our analysts help align analytical methods with the research question or business objective so that results are presented with appropriate context, uncertainty, and practical implications.
Have a dataset or research question that needs expert analysis? Share your objectives and data requirements with Statswork for structured data-analysis and interpretation support
Frequently Asked Questions (FAQs)
Data analysis is interpreted by examining patterns, trends, relationships, and statistical results to understand what the data means.
The seven steps are defining the objective, collecting data, cleaning data, exploring data, analyzing data, interpreting results, and communicating findings.
“Yes. ChatGPT can help interpret datasets, identify patterns and trends, explain statistical results, summarize findings, and present complex analytical results in simpler language. However, important research or business decisions should be validated using appropriate statistical methods and domain expertise.”
Examples include identifying sales trends, comparing groups, explaining survey results, and determining whether changes are statistically significant.
There is no single universally accepted four-part classification of data interpretation. Depending on the context, analysts may distinguish descriptive, diagnostic, predictive, and prescriptive analytics, while research statistics may separately distinguish descriptive and inferential analysis. The appropriate framework depends on the research or business question.
For example, if sales increased by 20% after a marketing campaign, the analysis identifies the observed increase. However, the increase alone does not establish that the campaign caused the change. Seasonality, pricing, competitor activity, distribution changes, or other factors may also have contributed. A causal interpretation requires an appropriate study design and assessment of alternative explanations.
References:
- Zairul, M. (2025). Mastering thematic analysis: A step-by-step guide for beginners with tips for systematic analysis using ATLAS. ti 25. .https://journals.sagepub.com/doi
- Bohm, I., & Sundqvist, J. (2025). Qualitative content analysis: a step-by-step guide forbeginners to the method, theories, epistemology, ontology, andrigour. Qualitative Report, 30(9), 4236-4263.https://www.researchgate.net
- Dueñas, A. N., Lazarus, M. D., & Byram, J. N. (2026). There is a method to the madness, and a madness to the method: a beginner’s guide to qualitative research. https://anatomypubs.onlinelibrary.