
- Services
- Data Analysis services
- Sample Work
Data Analysis services
- Secondary Qualitative Research Services
- Secondary Quantitative Research Services
- Meta-Analysis Research services
- Sample Work
Meta-Analysis Research Services
- Data Collection Services
- Sample Work
Data Collection Services
- Statistical & Biostatistics services
- Sample Work
Statistical Programming & Biostatistics services
- Data Management Services
- Sample Work
Data Management Services
- Research methodology services
- Sample Work
Research methodology services
- Tool Development Services
- Sample Work
Tool development services
- Statistical Interpretation services
-
Statistical Interpretation services
- Sample Work
Statistical Interpretation services
-
- Sample Size Calculation Services
-
Sample Size Calculation Services
- Sample Work
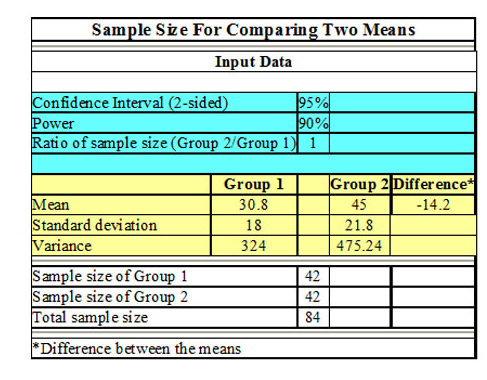
Sample Size Calculation Services
-
- AI & ML Services
-
Artificial Intelligence and Machine Learning Services
- Sample Work
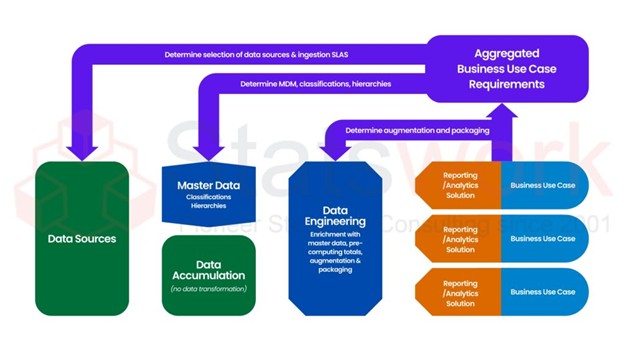
Artificial Intelligence and Machine Learning Services
-
- Meaningful Visualization Services
- Thought Leadership Services
- Report Generation Services
-
Report generation Service
- Sample Work
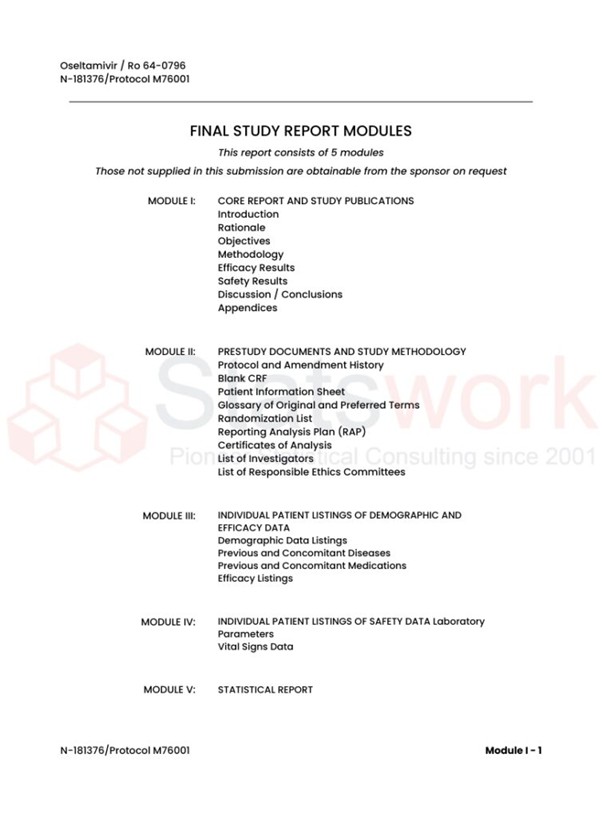
Report generation Services
-
- Data Analysis services
- Industries
- About Us
- Blog
- Insights
- Contact Us
- Services
- Data Analysis services
- Sample Work
Data Analysis services
- Secondary Qualitative Research Services
- Secondary Quantitative Research Services
- Meta-Analysis Research services
- Sample Work
Meta-Analysis Research Services
- Data Collection Services
- Sample Work
Data Collection Services
- Statistical & Biostatistics services
- Sample Work
Statistical Programming & Biostatistics services
- Data Management Services
- Sample Work
Data Management Services
- Research methodology services
- Sample Work
Research methodology services
- Tool Development Services
- Sample Work
Tool development services
- Statistical Interpretation services
-
Statistical Interpretation services
- Sample Work
Statistical Interpretation services
-
- Sample Size Calculation Services
-
Sample Size Calculation Services
- Sample Work
Sample Size Calculation Services
-
- AI & ML Services
-
Artificial Intelligence and Machine Learning Services
- Sample Work
Artificial Intelligence and Machine Learning Services
-
- Meaningful Visualization Services
- Thought Leadership Services
- Report Generation Services
-
Report generation Service
- Sample Work
Report generation Services
-
- Data Analysis services
- Industries
- About Us
- Blog
- Insights
- Contact Us
How Statistical Table Interpretation Reduces Errors in Research Reporting
- Home
- Insights
- Article
- How Statistical Table Interpretation Reduces Errors in Research Reporting
Qualitative Research Service
- Importance of Statistical Table Interpretation in Research
- Common Errors in Research Reporting Due to Poor Table Interpretation
- How Statistical Table Interpretation Improves Research Accuracy
- Guarantees the Application of Correct Statistical Methods
- Benefits of Professional Statistical Table Interpretation Services
- Why Correct Statistical Reporting Is Important
- Conclusion
News & Trends
Recommended Reads
Contact us
Summary:
Statistical table interpretation is critical in minimizing errors during research writing. Correct interpretation of SPSS results, regression tables, hypothesis test tables, and correlation tables can help in avoiding any form of confusion and errors in research writing. Reliable statistical interpretation services will be helpful for researchers in delivering quality research work. Statswork offers professional statistical table interpretation services for researchers.
Presentation of findings is one of the essential processes in the field of academia, medicine, business, and science. Data collection and statistical techniques alone cannot assure accurate presentation of research findings [1]. An appropriate and proper interpretation of findings is also crucial for researchers to make correct presentations and avoid any errors and misrepresentations in their reporting. This involves correct interpretation of statistical tables.
A statistical table includes a wealth of information about descriptive statistics, regression analysis, hypothesis testing, ANOVA, correlation analysis, chi-square tests, and numerous statistical techniques. It is important that the tables be interpreted appropriately to ensure that there are no misrepresentations of findings through erroneous data interpretation. Interpretation of statistical tables needs professional expertise in statistics and research methods and application of software like SPSS, SAS, R, Stata, and Excel.
Importance of Statistical Table Interpretation in Research
Studies in research require the collection of huge numbers of figures which must be analyzed using some scientific method. Statistical programs produce tables with figures such as p-values, confidence intervals, beta coefficients, standard deviation, significance level, and correlation coefficients among others [2]. Such tables might prove to be difficult for understanding by researchers who lack statistical knowledge.
Interpreting statistical tables assists in comprehending the data being analysed. This way, the researcher will be able to provide meaningful information regarding the figures produced through statistical analysis. As a result, the interpretation makes sure that the research results are accurate and reliable, conforming to the set objectives.
Inaccurate interpretation of statistical tables might make research results inaccurate and misleading. For instance, failure to comprehend such concepts as p-value or significance level may result in accepting incorrect hypotheses while dismissing correct ones. The same applies to interpreting regression coefficients.
Common Errors in Research Reporting Due to Poor Table Interpretation
Many research projects contain reporting mistakes because statistical tables are not interpreted correctly. Some common errors include:
| Error in Statistical Interpretation | Description |
| Misinterpretation of P-Values | Wrong conclusions on statistical significance and tests’ outcomes. |
| Data Presentation Errors | Wrong reporting of mean, percentage, and standard deviation statistics. |
| Incorrect Hypothesis Testing | Wrong conclusions on whether to accept or reject a null hypothesis [ 3]. |
| Regression Misinterpretation | Incorrect conclusions about regression coefficients. |
| Correlation Confusion | Wrong conclusion that there is causality between correlated variables. |
These errors reduce the credibility of research work and may result in rejection from academic journals, universities, or professional organizations.
How Statistical Table Interpretation Improves Research Accuracy
Professional interpretation of statistical tables can help in reducing reporting errors and increase the standard of research documentation. All the outputs are thoroughly analyzed and explained.
Increases Clarity of the Research Results
The process of statistical interpretation is responsible for making sense out of complicated numerical data. The clarity of research results is improved by doing so.
Decreases Errors in Report Writing
Interpretation will reduce any errors in hypothesis testing, regression analysis, descriptive statistics, and comparison of the data.
Enables Sound Judgment
The correct interpretation will enable the stakeholders to make sound judgments based on statistically correct data [4].
Improves the Credibility of Research
Interpretation helps in improving the reliability and authenticity of the research results.
Guarantees the Application of Correct Statistical Methods
The professional process will guarantee that the right statistical tests were applied, and the results justify the objective of the research.
Helps to Satisfy Academic Standards
Many institutions of higher learning demand appropriate reporting standards. This service helps with adhering to the set standards.
Role of SPSS Table Interpretation in Research Reporting
SPSS is one of the most popularly used statistical software programs in scientific research. It produces several statistical tables that must be comprehensively interpreted. SPSS table interpretation involves the proper interpretation of outputs concerning:
- Descriptive statistics
- T-test analysis
- Analysis of variance
- Regression analysis
- Correlation analysis
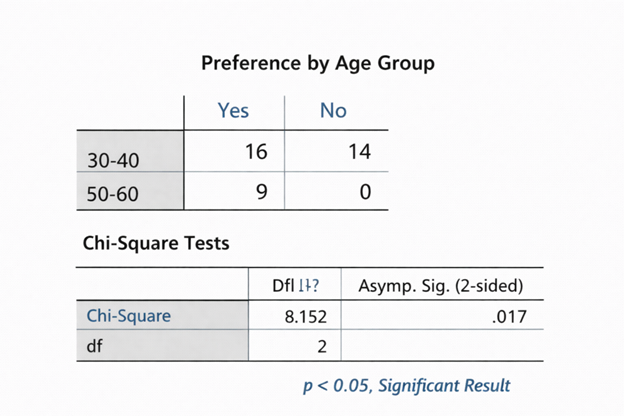
- Chi-square test analysis
- Reliability analysis
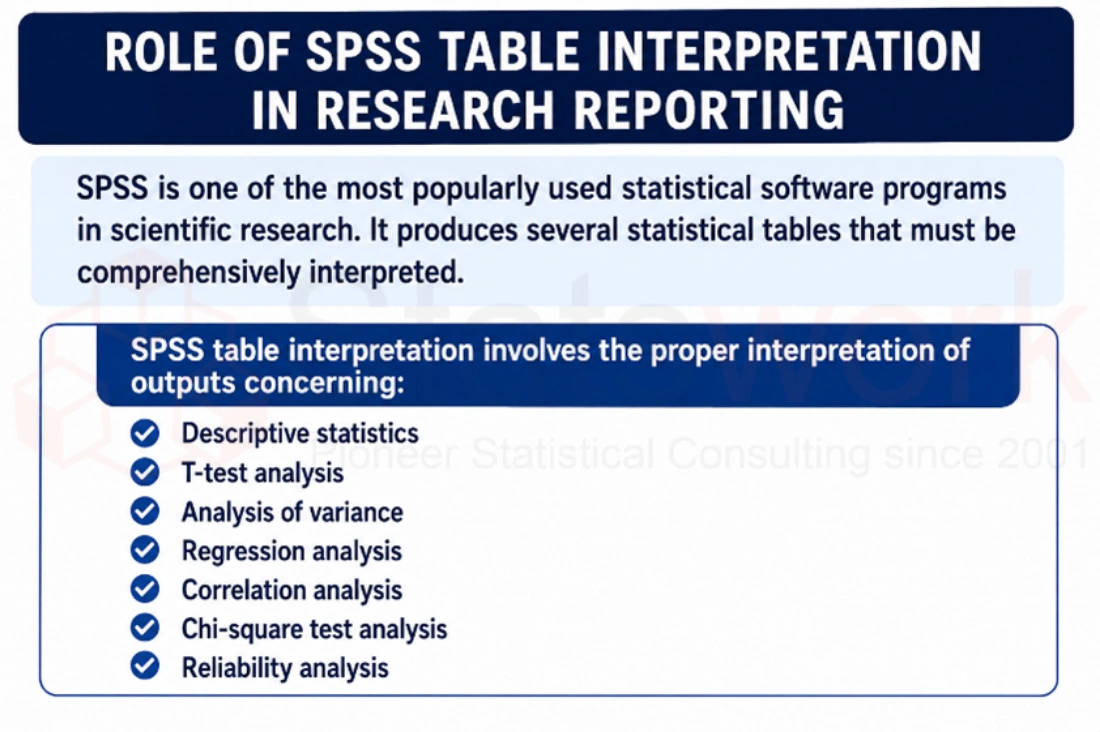
Professional SPSS table interpretation will help in ensuring that accurate results are produced in dissertations, research papers, and business reports [5].
Benefits of Professional Statistical Table Interpretation Services
The majority of scholars require professional help in interpreting statistics due to the complexity in understanding the results of any research. There are various benefits associated with professional services:
Expert Statisticians’ Skills
Experts understand advanced methods of conducting and interpreting research.
Accuracy in Statistics
Errors in reporting can be detected and corrected prior to submitting the research or publishing the article.
Saving Researchers’ Time
Scholars can concentrate on other aspects of their work while professionals interpret statistics.
Better Presentation of Research
Statistical tables are interpreted well thus ensuring the effective presentation of the study.
Increased Chances for Academic Publishing
Correctness of statistical information makes it easier for an article to be published.
Individual Approach to Statistics
Interpretation is provided considering particular goals and the design of the study.
Why Correct Statistical Reporting Is Important
Any scientific finding influences academic advancement, medical treatment, business strategy development, and governmental decisions. An error in statistical information may result in incorrect decisions and conclusions. Correct statistical information will ensure consistency and accuracy in research studies.
Also, proper statistical tables’ interpretation is necessary to protect oneself from any criticism when presenting thesis and articles at academic conferences or during peer review process.
Conclusion
Interpretation of statistical tables is a crucial element of proper research presentation. This allows researchers to comprehend the complicated outputs provided by statistical tools, minimize any form of error in research reporting and deliver quality research results. Interpretation of SPSS, regression table, ANOVA, correlation and hypothesis testing statistics is necessary to derive reliable research conclusions.
Professional statistical table interpretation services greatly contribute to increasing the quality and accuracy of research presentations through which evidence-based decisions can be made [4]. Researchers who utilize such interpretation services stand to gain a lot from such investments as well as enhance their academic and publishing careers.
Statswork provides statistical table interpretation services for researchers, students, scholars, and organizations in order to ensure quality research output without errors. By offering professional SPSS and statistical interpretation services, Statswork ensures the best research outcomes.
Reference
- Lakshmanan, M. (2022). Common Errors in Using Statistical Tools and Data Presentation. In Introduction to Basics of Pharmacology and Toxicology: Volume 3: Experimental Pharmacology: Research Methodology and Biostatistics(pp. 897-910). Singapore: Springer Nature Singapore.https://link.springer.com/chapter/10.1007/978-981-19-5343-9_63
- Kalnins, A., & Praitis Hill, K. (2025). The VIF score. What is it good for? Absolutely nothing. Organizational research methods, 28(1), 58-75.https://journals.sagepub.com/doi/abs/10.1177/10944281231216381
- Kotronoulas, G., Miguel, S., Dowling, M., Fernández-Ortega, P., Colomer-Lahiguera, S., Bağçivan, G., … & Papadopoulou, C. (2023, April). An overview of the fundamentals of data management, analysis, and interpretation in quantitative research. In Seminars in oncology nursing(Vol. 39, No. 2, p. 151398). WB Saunders.https://www.sciencedirect.com/science/article/pii/S0749208123000293
- Ahmed, S. K. (2024). How to choose a sampling technique and determine sample size for research: A simplified guide for researchers. Oral Oncology Reports, 12, 100662.https://www.sciencedirect.com/science/article/pii/S2772906024005089
- Paul, J., & Barari, M. (2022). Meta‐analysis and traditional systematic literature reviews—What, why, when, where, and how?. Psychology & Marketing, 39(6), 1099-1115.https://onlinelibrary.wiley.com/doi/abs/10.1002/mar.21657