
- Services
- Data Analysis services
- Sample Work
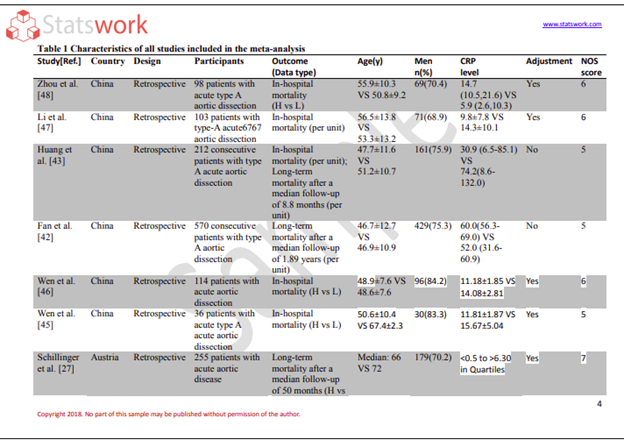
Data Analysis services
- Secondary Qualitative Research Services
- Secondary Quantitative Research Services
- Meta-Analysis Research services
- Sample Work
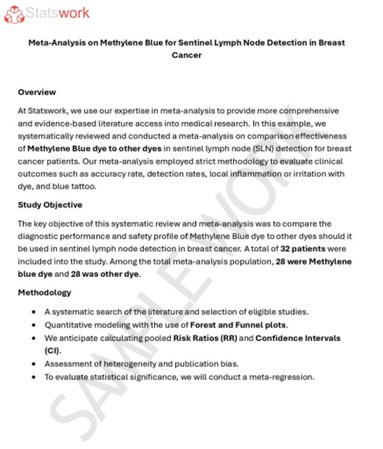
Meta-Analysis Research Services
- Data Collection Services
- Sample Work
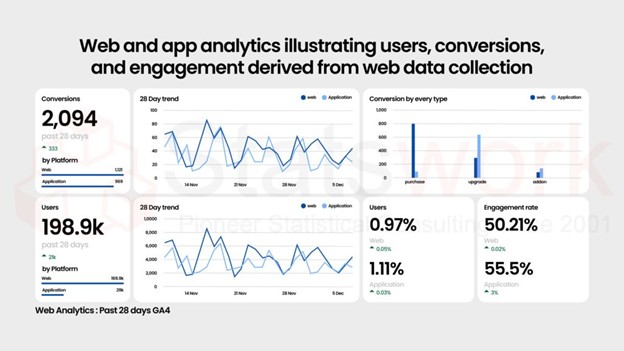
Data Collection Services
- Statistical & Biostatistics services
- Sample Work
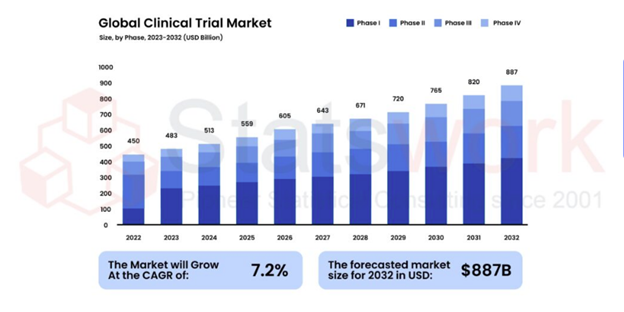
Statistical Programming & Biostatistics services
- Data Management Services
- Sample Work
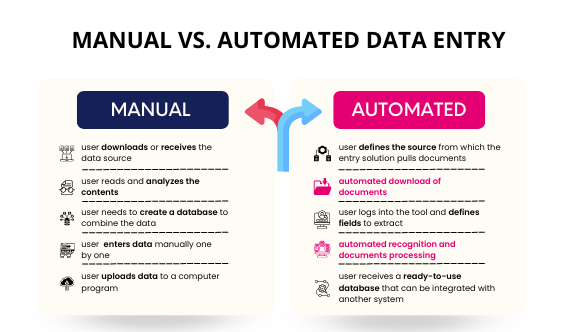
Data Management Services
- Research methodology services
- Sample Work
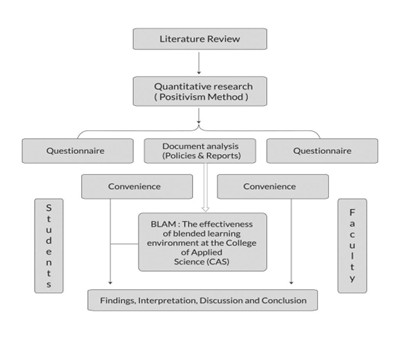
Research methodology services
- Tool Development Services
- Sample Work
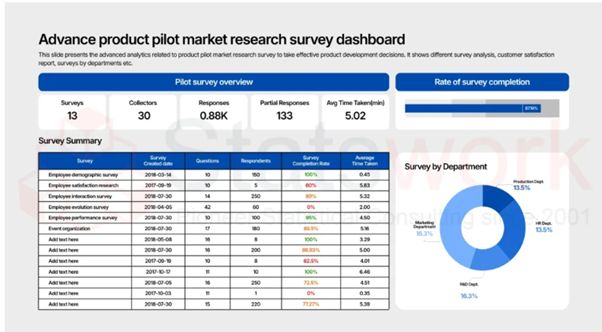
Tool development services
- Statistical Interpretation services
-
Statistical Interpretation services
- Sample Work
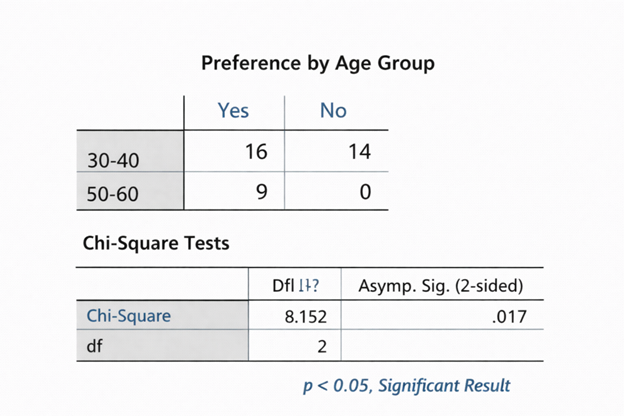
Statistical Interpretation services
-
- Sample Size Calculation Services
-
Sample Size Calculation Services
- Sample Work
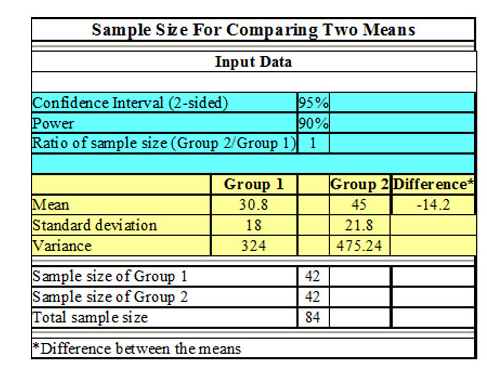
Sample Size Calculation Services
-
- AI & ML Services
-
Artificial Intelligence and Machine Learning Services
- Sample Work
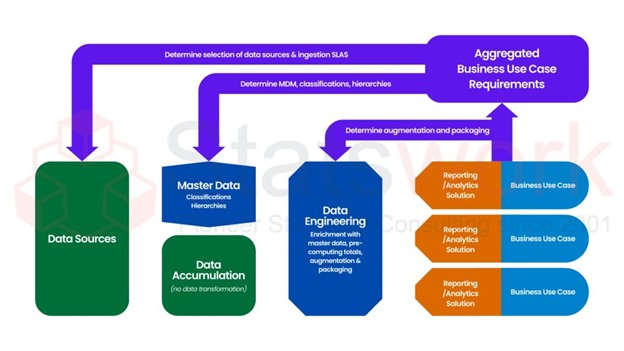
Artificial Intelligence and Machine Learning Services
-
- Meaningful Visualization Services
- Thought Leadership Services
- Report Generation Services
-
Report generation Service
- Sample Work
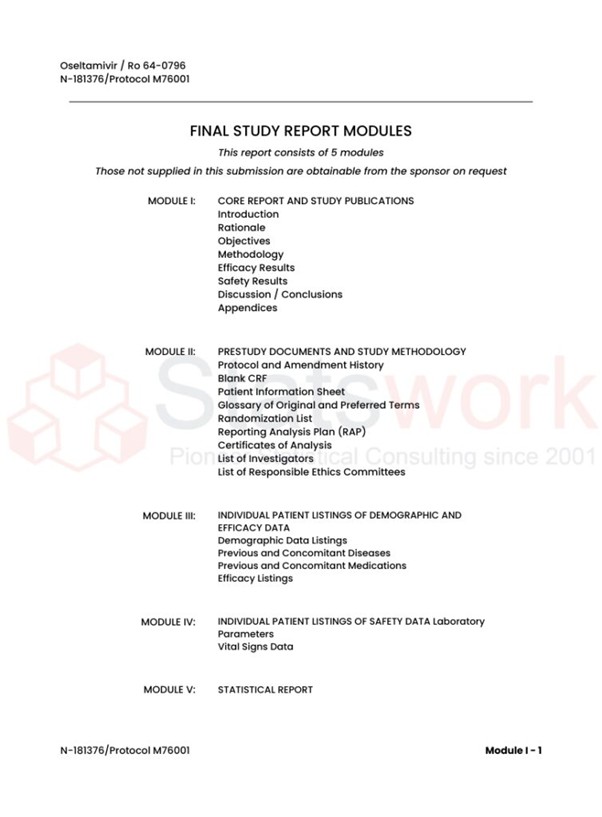
Report generation Services
-
- Data Analysis services
- Industries
- About Us
- Blog
- Insights
- Contact Us
- Services
- Data Analysis services
- Sample Work
Data Analysis services
- Secondary Qualitative Research Services
- Secondary Quantitative Research Services
- Meta-Analysis Research services
- Sample Work
Meta-Analysis Research Services
- Data Collection Services
- Sample Work
Data Collection Services
- Statistical & Biostatistics services
- Sample Work
Statistical Programming & Biostatistics services
- Data Management Services
- Sample Work
Data Management Services
- Research methodology services
- Sample Work
Research methodology services
- Tool Development Services
- Sample Work
Tool development services
- Statistical Interpretation services
-
Statistical Interpretation services
- Sample Work
Statistical Interpretation services
-
- Sample Size Calculation Services
-
Sample Size Calculation Services
- Sample Work
Sample Size Calculation Services
-
- AI & ML Services
-
Artificial Intelligence and Machine Learning Services
- Sample Work
Artificial Intelligence and Machine Learning Services
-
- Meaningful Visualization Services
- Thought Leadership Services
- Report Generation Services
-
Report generation Service
- Sample Work
Report generation Services
-
- Data Analysis services
- Industries
- About Us
- Blog
- Insights
- Contact Us
Automated Data Analysis and Statistical Report Generation Services Explained
- Home
- Insights
- Article
- Automated Data Analysis and Statistical Report Generation Services Explained
Qualitative Research Service
News & Trends
Recommended Reads
Contact us
Overview
Data Analysis and Statistics Reporting Service utilizes automation technologies to conduct efficient analysis of vast amounts of data by using various software applications such as SPSS, SAS, R, and Python. Such a service makes business and research processes much easier and facilitates sound decision making through automated reporting.
In the present data-centric age, various business entities, scholars, and enterprises produce huge amounts of data every single day. However, it does not stop there; the real challenge lies in analyzing this data correctly and using the knowledge gained in decision-making processes. In other words, the need for automated data analysis and generation of statistical reports arises here [1].
The use of automation tools in the realm of statistical analysis revolutionizes this process in numerous ways. Rather than dedicating many days to sorting out the data, calculating numbers, and writing reports by hand, one can now perform all these tasks quickly and effectively with automated tools.
What Is Automated Data Analysis?
Automated data analysis refers to an approach that involves the utilization of sophisticated statistics and technologies to process, interpret, analyze and evaluate datasets with little or no need for human input [2]. The automated process includes the cleansing, transforming, testing, visualizing, interpreting, and reporting of the dataset.
The current technological advancements allow the analysis software to conduct advanced statistical processes such as regression analysis, hypothesis testing, ANOVA, predicting models, forecasting trends, and machine learning analysis without human assistance. Automated analysis tools are usually based on advanced statistical software such as SPSS, SAS, R, Python, MATLAB, and STATA.
Through automated data analysis, organizations are able to manage big data easily.
Understanding Statistical Report Generation Services
Statistical report creation is a process of developing structured reports containing data findings, analyses, trends, conclusions, and interpretation of the data analysis performed.
The structure of a typical statistical report consists of:
- Data summaries
- Graphics/charts
- Statistical analysis
- Hypothesis testing conclusions
- Predictions
- Suggestions
- Conclusions on research
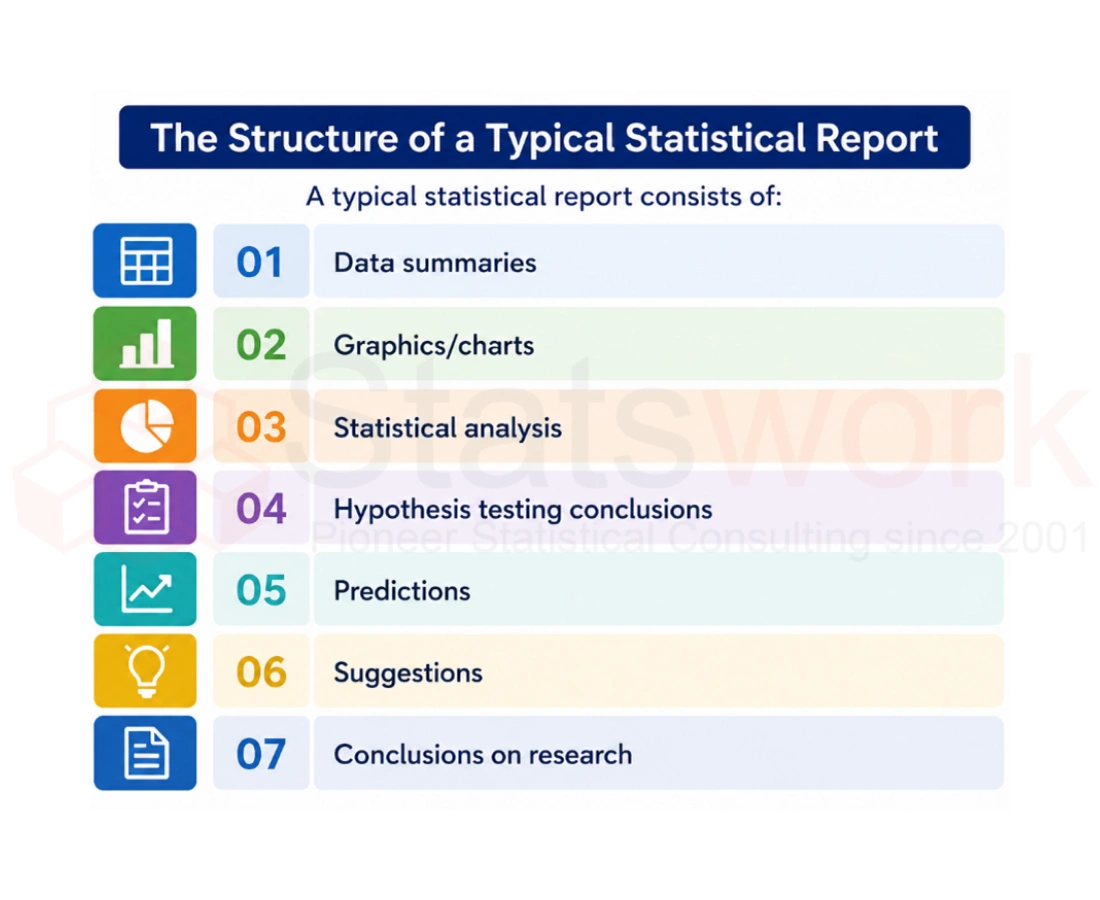
An automated statistical reporting tool can create a statistical report in no time through the extraction of data analyses from software packages.
What Automated Data Analysis Works
The steps that need to be taken during automated data analysis are:
1. Data Collection
First, there is an initial collection of raw data from different sources including surveys, database files, spreadsheet files, customer databases, health care databases, or research databases.
2. Data Cleansing and Preparation
After collecting data, there is the need to cleanse and prepare it for analysis, since data collected in raw form has missing entries, duplications, inaccuracies, or formatting problems.
3. Statistical Analysis
With prepared data at hand, statistical analysis starts and depends on the purpose; it may include descriptive analysis, inferential analysis, prediction models, correlation analysis, or trend analysis [3].
4. Data Visualization
Data is visualized in forms of charts, graphs, dashboards, or tables by the automated systems that help stakeholders analyze results much easier.
5. Report Generation
As soon as all analyses are done, the report can be generated. It may be done either in Word, Excel, PowerPoint, or PDF.
Benefits of Automated Data Analysis and Report Generation
- Increased Precision Manual analysis makes it more likely for there to be computation errors. Since automated systems follow set statistical models and algorithms, errors are eliminated.
- Speed There is considerable time saved through automation because the system does not take time to make calculations that would require human effort
- Efficiency Companies reduce operational expenses since they do not have to employ staff members to carry out manual analysis [3].
- Scalability Automated analysis can be used to deal with large amounts of data and, hence, suits larger companies like health care providers, corporations, universities, and market research firms.
- Increased Productivity Analysts can use their free time to come up with a plan for interpreting the report.
- Consistency Automated templates help to maintain consistency in reporting.
Difficulties in Automated Data Analysis
Despite various benefits provided by automation, certain difficulties also arise.
Data Quality
Data used for analyses may prove of poor quality, resulting in errors in results. It is important to validate the data before analyzing it.
Complexity of Interpretations
Automated processes will generate statistical data but, often, expertise would be necessary for drawing conclusions from that data [4].
Security and Privacy
Companies working with confidential information need to take care of ensuring secure storage of the data and adhering to privacy-related laws.
Integration into Current System
Sometimes, integrating the automated processes may prove to be challenging and costly.
Future of Automated Statistical Reporting
The future of automated statistical analysis lies within the field of artificial intelligence and machine learning technology. Technology is growing smarter every day allowing prediction of results, report generation and real-time decision-making.
Today’s AI-enabled statistical tools can reveal hidden patterns, anomalies, and give recommendations based on analyzed data. With time, automated statistical reports will continue becoming more personalized, precise, and ubiquitous [4].
Big data technology and cloud computing are also enhancing capabilities of automated statistical analysis by giving companies abilities to analyze vast amounts of data wherever they are located.
Conclusion
With the help of automated data analysis and statistical report generation services, businesses can transform the entire process of managing their data through automation. This helps them to save time, be more accurate and productive, and most importantly to take effective decisions in a timely manner.
In all sectors of industry, including finance, medicine, business intelligence, and academia, automated analytics are increasingly being used as one of the indispensable means of gaining deeper insight into various processes and phenomena. With the development of artificial intelligence, the future of statistical reporting looks bright indeed.
By embracing automated data analysis services now, businesses obtain a competitive advantage in transforming data into meaningful business intelligence in an efficient manner.
We offer professional Automated Data Analysis and Statistical Reporting services at Statswork. Our team specializes in providing customized, accurate, and top-quality statistical analysis reports using SPSS, SAS, R, Python, STATA and other data analysis techniques to satisfy the unique needs of researchers, business organizations, health care establishments, academics etc.
Reference
- Yuan, H., Yu, K., Xie, F., Liu, M., & Sun, S. (2024). Automated machine learning with interpretation: A systematic review of methodologies and applications in healthcare. Medicine Advances, 2(3), 205-237. https://onlinelibrary.wiley.com/doi/abs/10.1002/med4.75?__cf_chl_tk=3SUq9ghTIVX4vIVFIBD7HCaDIQodtDi4snnbefVTDA8-1779943973-1.0.1.1-D5BsIzDODOU0YQ1ECRvoDUiXoQtcD5kGIhBGlDNwoAs
- Rahul, K., Banyal, R. K., & Arora, N. (2023). A systematic review on big data applications and scope for industrial processing and healthcare sectors. Journal of Big Data, 10(1), 133. https://link.springer.com/article/10.1186/s40537-023-00808-2
- Paramesha, M., Rane, N., & Rane, J. (2024). Artificial intelligence, machine learning, deep learning, and blockchain in financial and banking services: A comprehensive review. Machine Learning, Deep Learning, and Blockchain in Financial and Banking Services: A Comprehensive Review (June 6, 2024). https://papers.ssrn.com/sol3/papers.cfm?abstract_id=4855893
- Khan, B., Saifullah, J., Khan, W., & Chughtai, M. (2024). An overview of ETL techniques, tools, processes and evaluations in data warehousing. Journal on Big Data, 6, 1. https://www.proquest.com/openview/d4f5172d55e69fdeed865940b0262724/1?pq-origsite=gscholar&cbl=4585453