
- Services
- Data Analysis services
- Sample Work
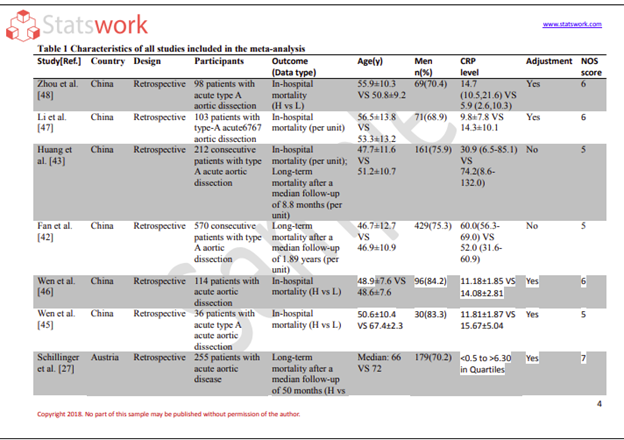
Data Analysis services
- Secondary Qualitative Research Services
- Secondary Quantitative Research Services
- Meta-Analysis Research services
- Sample Work
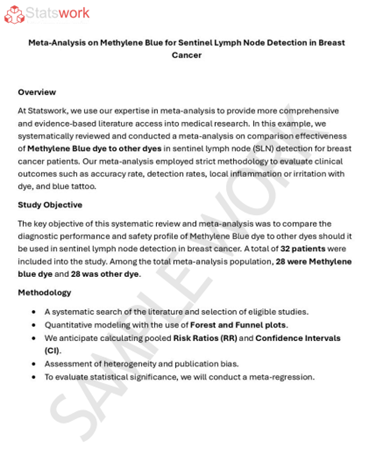
Meta-Analysis Research Services
- Data Collection Services
- Sample Work
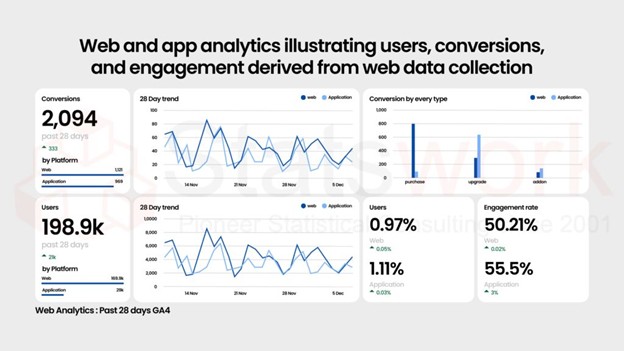
Data Collection Services
- Statistical & Biostatistics services
- Sample Work
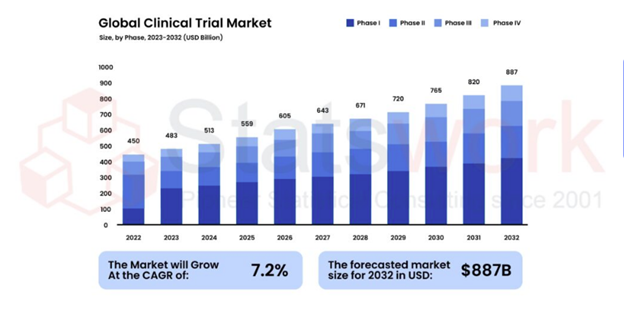
Statistical Programming & Biostatistics services
- Data Management Services
- Sample Work
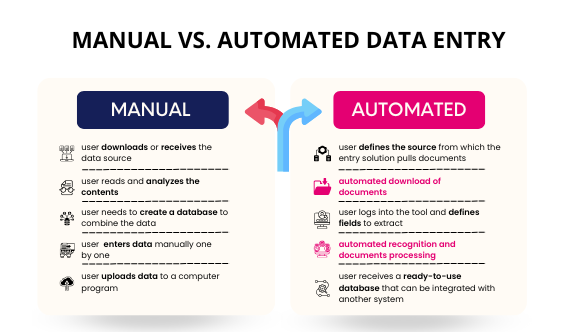
Data Management Services
- Research methodology services
- Sample Work
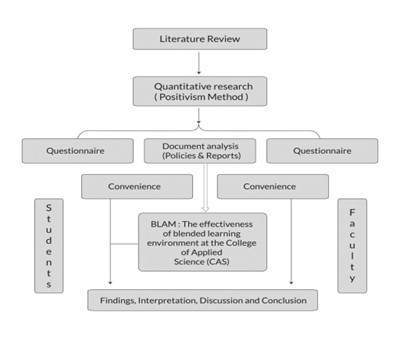
Research methodology services
- Tool Development Services
- Sample Work
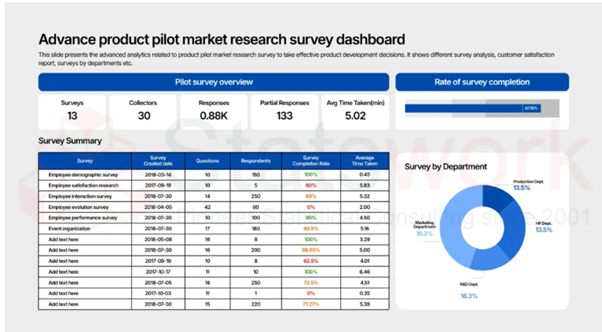
Tool development services
- Statistical Interpretation services
-
Statistical Interpretation services
- Sample Work
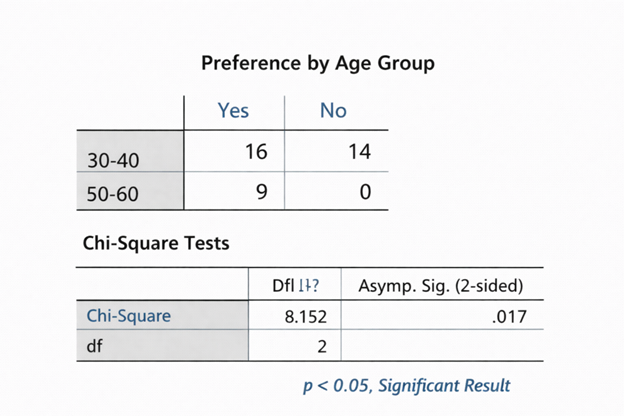
Statistical Interpretation services
-
- Sample Size Calculation Services
-
Sample Size Calculation Services
- Sample Work
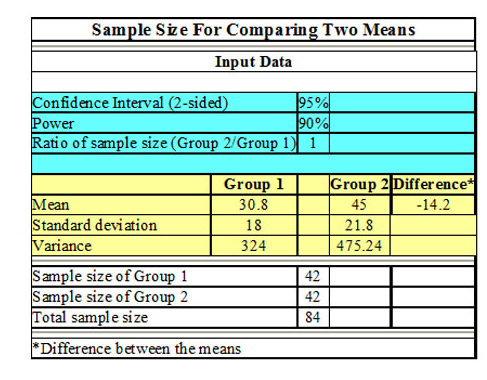
Sample Size Calculation Services
-
- AI & ML Services
-
Artificial Intelligence and Machine Learning Services
- Sample Work
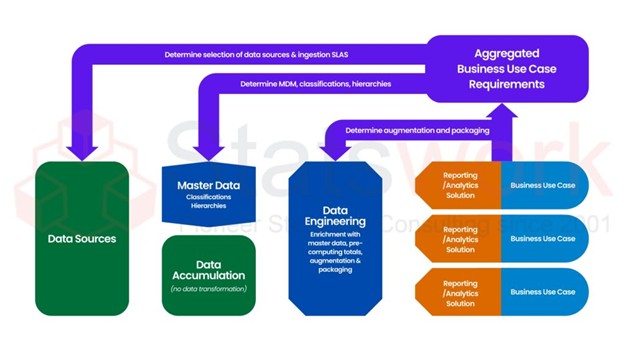
Artificial Intelligence and Machine Learning Services
-
- Meaningful Visualization Services
- Thought Leadership Services
- Report Generation Services
-
Report generation Service
- Sample Work
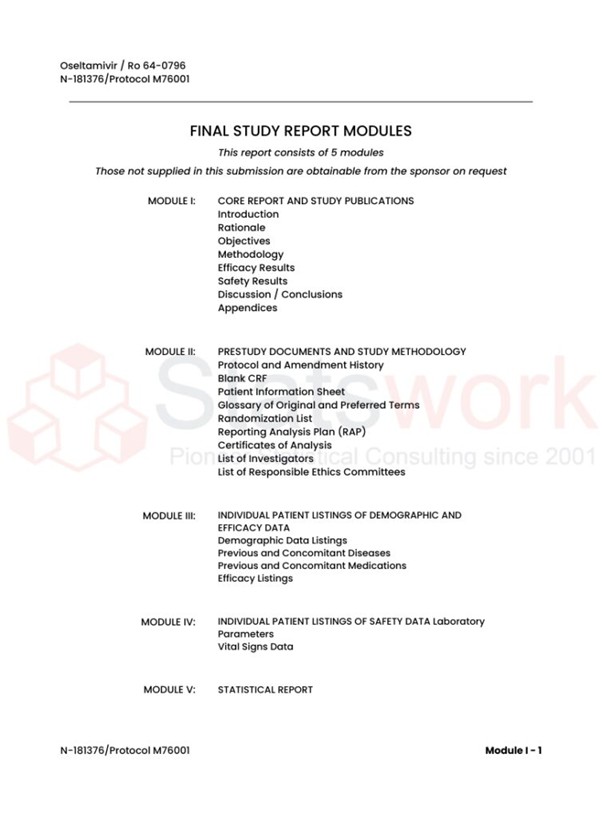
Report generation Services
-
- Data Analysis services
- Industries
- About Us
- Blog
- Insights
- Contact Us
- Services
- Data Analysis services
- Sample Work
Data Analysis services
- Secondary Qualitative Research Services
- Secondary Quantitative Research Services
- Meta-Analysis Research services
- Sample Work
Meta-Analysis Research Services
- Data Collection Services
- Sample Work
Data Collection Services
- Statistical & Biostatistics services
- Sample Work
Statistical Programming & Biostatistics services
- Data Management Services
- Sample Work
Data Management Services
- Research methodology services
- Sample Work
Research methodology services
- Tool Development Services
- Sample Work
Tool development services
- Statistical Interpretation services
-
Statistical Interpretation services
- Sample Work
Statistical Interpretation services
-
- Sample Size Calculation Services
-
Sample Size Calculation Services
- Sample Work
Sample Size Calculation Services
-
- AI & ML Services
-
Artificial Intelligence and Machine Learning Services
- Sample Work
Artificial Intelligence and Machine Learning Services
-
- Meaningful Visualization Services
- Thought Leadership Services
- Report Generation Services
-
Report generation Service
- Sample Work
Report generation Services
-
- Data Analysis services
- Industries
- About Us
- Blog
- Insights
- Contact Us
Meta-Analysis Statistical Visualization Techniques for Evidence-Based Research Interpretation
- Home
- Insights
- Article
- Meta-Analysis Statistical Visualization Techniques for Evidence-Based Research Interpretation
Qualitative Research Service
- Importance of Meta-Analysis Statistical Visualization
- Key Benefits of Statistical Visualization
- Common Techniques Used in Meta-Analysis Statistical Visualization
- Forest Plot Meta Analysis
- Features of Forest Plots
- Example of Forest Plot Components
- Funnel Plots in Meta-Analysis
- Advantages of Funnel Plots
- Meta Analysis Statistical Visualization in Research
- Future of Meta-Analysis Statistical Visualization
- Conclusion
News & Trends
Recommended Reads
Contact us
Introduction
- 1. Importance of Meta-Analysis Statistical Visualization
- 2. Key Benefits of Statistical Visualization
- 3. Common Techniques Used in Meta-Analysis Statistical Visualization
- 4. Forest Plot Meta Analysis
- 5. Features of Forest Plots
- 6. Example of Forest Plot Components
- 7. Funnel Plots in Meta-Analysis
- 8. Advantages of Funnel Plots
- 9. Meta Analysis Statistical Visualization in Research
- 10. Future of Meta-Analysis Statistical Visualization
- 11. Conclusion
Meta-analysis is one of the most powerful research tools that are applied to integrate results from various independent studies and come up with valid and evidence-based conclusions. In contemporary scientific studies, large amounts of statistical data may be hard to comprehend without visualization. Here comes the significance of Meta-Analysis Statistical Visualization [1]. The use of statistical visualization enables researchers to transform complicated numerical data into graphs, charts, and diagrams that facilitate understanding of such data.
In today’s world, more scientists working in the fields of healthcare, biotechnology, pharmaceuticals, nutrition, environment, and social sciences rely on Meta Analysis Statistical Visualization in Research.
Importance of Meta-Analysis Statistical Visualization
The process of meta-analysis entails pooling data from different studies to derive an estimate of the pooled effect size and discover patterns. Nevertheless, the results of such analyses are not always easy to comprehend. Visualization methods make such analyses simpler and easier to conduct.
Key Benefits of Statistical Visualization
| Benefit | Description |
| Interpretation of Data | Easier for researchers to interpret complicated statistical data |
| Increased Clarity | Increases the ease with which research results can be validated |
| Evidence-Based Decisions | Contributes towards making evidence-based decisions in healthcare |
| Identification of Patterns | Identify trends, similarities, and differences between the studies |
| Communication Made Easy | Simplifies communication of the results |
Visualization tools are vital since they minimize confusion in systematic reviews and meta-analysis studies [2].
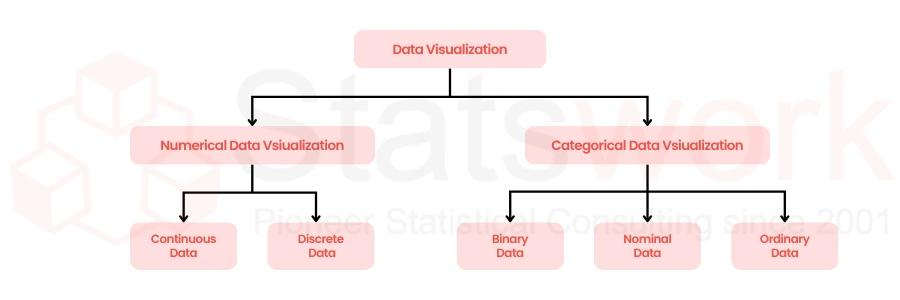
Common Techniques Used in Meta-Analysis Statistical Visualization
There exist various visualization tools employed in representing statistical information in meta-analysis studies. Each visualization tool is unique based on the nature of data and research objectives.
Forest Plot Meta Analysis
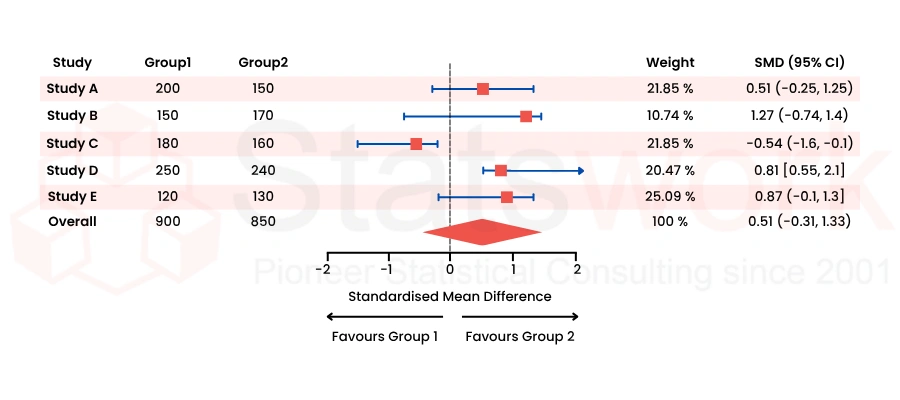
Forest Plot Meta Analysis is among the most frequently applied visualization tools in evidence-based studies. This visualization tool presents effect sizes and confidence intervals for the individual studies involved in the meta-analysis.
Features of Forest Plots
- Displays individual studies
- Displays confidence intervals graphically
- Gives overall effect size
- Helps in identifying consistency of studies
- Enables comparisons among different studies
Example of Forest Plot Components
| Component | Usage |
| Squares | Effect sizes of individual studies |
| Horizontal lines | Confidence intervals |
| Diamond shape | Overall effect size |
| Vertical line | Line for no effect |
Forest plot is a type of graphical representation extensively used in clinical research to determine the effectiveness of treatments and interventions [3].
Funnel Plots in Meta-Analysis
Another significant example of Meta Analysis Statistical Visualization is the funnel plot. The funnel plot assists in the detection of publication bias in systematic reviews and meta-analysis research.
Symmetric distribution of studies around the pooled estimate implies that there is no evidence of publication bias. Asymmetry might suggest the presence of publication bias.
Advantages of Funnel Plots
| Advantage | Explanation |
| Detection of Publication Bias | Identifies missing or selectively published studies |
| Improvement in Research Quality | Aids in assessing the quality of evidence |
| Statistical Precision | Increases confidence in meta-analysis findings |
Funnel plots become very crucial when dealing with medical and pharmaceutical research due to the impact of publication bias on the results [4].
Meta Analysis Statistical Visualization in Research
The use of Meta Analysis Statistical Visualization in Research has greatly increased due to the increasing use of evidence-based practices and big data analysis.
Applications Across Different Industries
| Industry | Applications |
| Healthcare | Evaluation of clinical trials |
| Pharmaceuticals | Evaluation of drug effectiveness |
| Nutrition Science | Evaluation of dietary interventions |
| Environmental Science | Analysis of pollution and climate change |
| Biotechnology | Biological pathway analysis |
Visualization methods aid researchers to better understand the data sets in an efficient manner and at the same time enhance the communication process with both scientific and non-scientific communities.
Future of Meta-Analysis Statistical Visualization
Advancements like artificial intelligence, machine learning, and dashboards are making future statistical visualization more efficient through technological developments.
Some of the features that will make the future of statistical visualization include:
- Pattern recognition
- Creation of analytical dashboards in real-time
- Predictive analysis
- Making it easier to interpret huge data sets
It is expected that these developments will contribute to better efficiency in research [3].
Conclusion
Meta-Analysis Statistical Visualization has become an important part of evidence-based research because it translates complicated statistical data into understandable visual information. Methods like forest plot meta-analysis, funnel plots, heat maps, and network diagrams make it easier to interpret the results of many studies by enhancing research transparency.
Importance of Meta Analysis Statistical Visualization in Research reveals how much this concept is becoming crucial because of the increasing need for evidence-based decisions in health care, pharmaceutical, biotechnology, nutrition, and environmental science fields [4]. An effective Meta Analysis Statistical Visualization service is one that shows how visualization enhances research.
Research support service providers like Statswork are significant contributors in ensuring that researchers and academicians conduct precise meta-analysis, statistical analysis, and visualization of data for evidence-based research findings.
Reference
- Carlson, R. B., Martin, J. R., & Beckett, R. D. (2023). Ten simple rules for interpreting and evaluating a meta-analysis. PLOS Computational Biology, 19(9), e1011461. https://journals.plos.org/ploscompbiol/article?id=10.1371/journal.pcbi.1011461
- Yang, Y., Lagisz, M., & Nakagawa, S. (2025). Visualization toolkits for enriching meta-analyses through evidence maps, bibliometrics, and alternative impact metrics. Research Synthesis Methods, 16(1), 15-29. https://www.cambridge.org/core/
- Kossmeier, M., Tran, U. S., & Voracek, M. (2020). Charting the landscape of graphical displays for meta-analysis and systematic reviews: a comprehensive review, taxonomy, and feature analysis. BMC medical research methodology, 20(1), 26. https://link.springer.com/article/10.118
- Ostinelli, E. G., Efthimiou, O., Naci, H., Furukawa, T. A., Leucht, S., Salanti, G., … & Cipriani, A. (2022). Vitruvian plot: a visualization tool for multiple outcomes in network meta-analysis. Evidence Based Mental Health, 25(e1). https://mentalhealth.bmj.com/