
- Services
- Data Analysis services
- Sample Work
Data Analysis services
- Secondary Qualitative Research Services
- Secondary Quantitative Research Services
- Meta-Analysis Research services
- Sample Work
Meta-Analysis Research Services
- Data Collection Services
- Sample Work
Data Collection Services
- Statistical & Biostatistics services
- Sample Work
Statistical Programming & Biostatistics services
- Data Management Services
- Sample Work
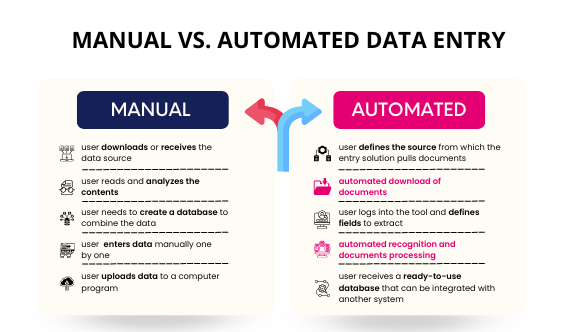
Data Management Services
- Research methodology services
- Sample Work
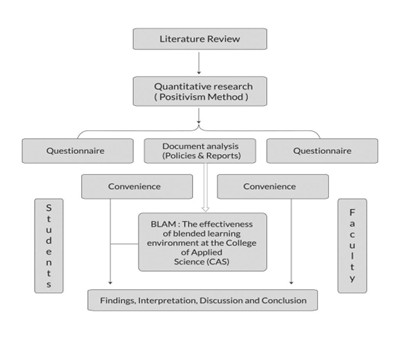
Research methodology services
- Tool Development Services
- Sample Work
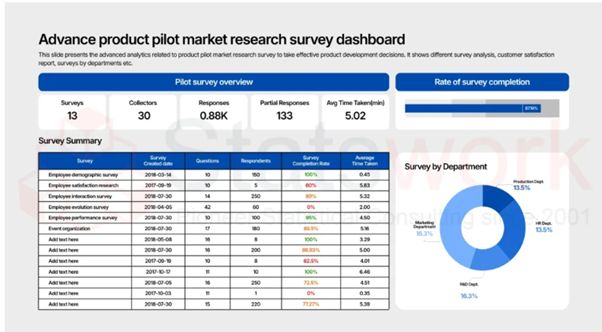
Tool development services
- Statistical Interpretation services
-
Statistical Interpretation services
- Sample Work
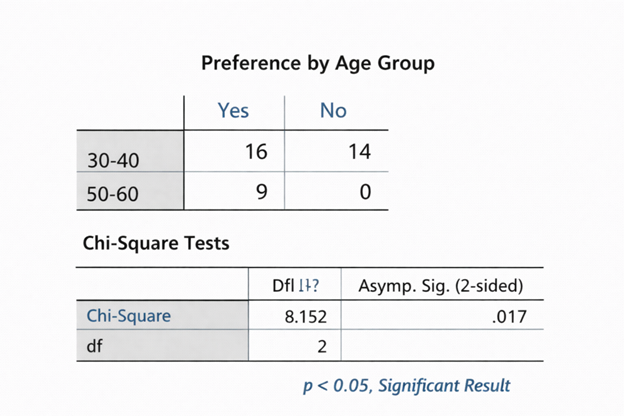
Statistical Interpretation services
-
- Sample Size Calculation Services
-
Sample Size Calculation Services
- Sample Work
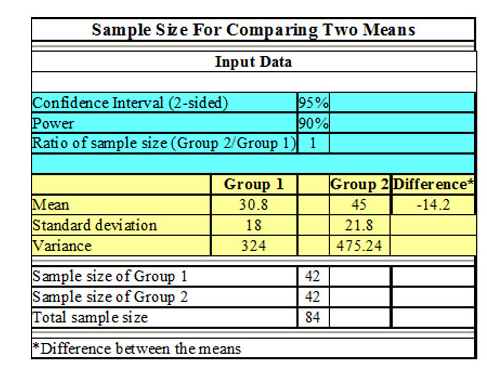
Sample Size Calculation Services
-
- AI & ML Services
-
Artificial Intelligence and Machine Learning Services
- Sample Work
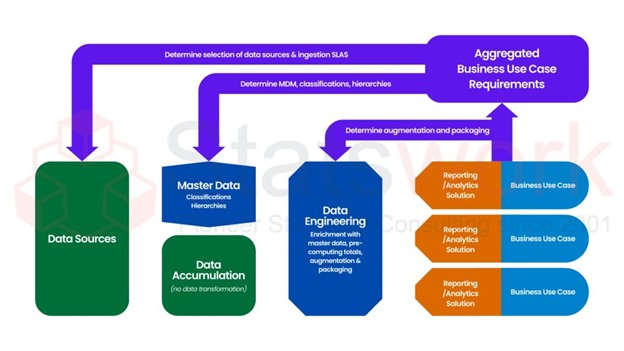
Artificial Intelligence and Machine Learning Services
-
- Meaningful Visualization Services
- Thought Leadership Services
- Report Generation Services
-
Report generation Service
- Sample Work
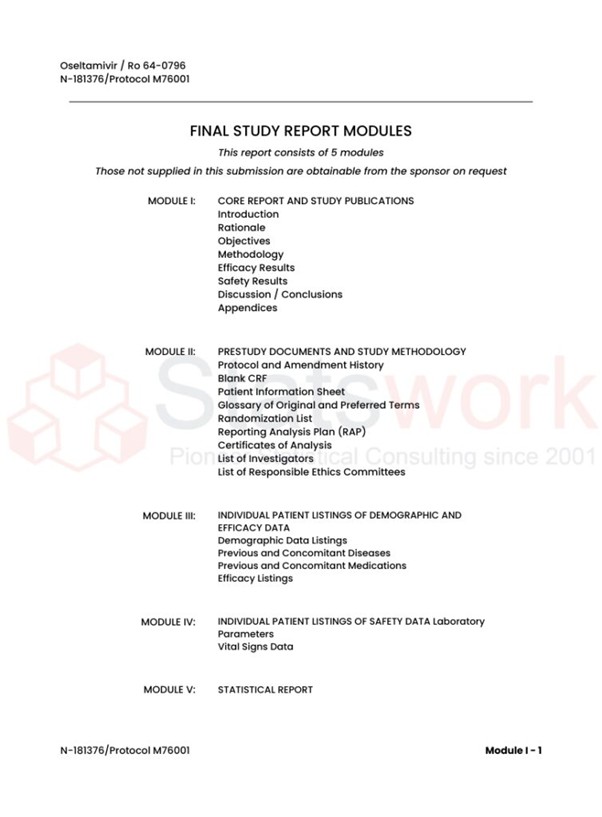
Report generation Services
-
- Data Analysis services
- Industries
- About Us
- Blog
- Insights
- Contact Us
- Services
- Data Analysis services
- Sample Work
Data Analysis services
- Secondary Qualitative Research Services
- Secondary Quantitative Research Services
- Meta-Analysis Research services
- Sample Work
Meta-Analysis Research Services
- Data Collection Services
- Sample Work
Data Collection Services
- Statistical & Biostatistics services
- Sample Work
Statistical Programming & Biostatistics services
- Data Management Services
- Sample Work
Data Management Services
- Research methodology services
- Sample Work
Research methodology services
- Tool Development Services
- Sample Work
Tool development services
- Statistical Interpretation services
-
Statistical Interpretation services
- Sample Work
Statistical Interpretation services
-
- Sample Size Calculation Services
-
Sample Size Calculation Services
- Sample Work
Sample Size Calculation Services
-
- AI & ML Services
-
Artificial Intelligence and Machine Learning Services
- Sample Work
Artificial Intelligence and Machine Learning Services
-
- Meaningful Visualization Services
- Thought Leadership Services
- Report Generation Services
-
Report generation Service
- Sample Work
Report generation Services
-
- Data Analysis services
- Industries
- About Us
- Blog
- Insights
- Contact Us
Impact of Funnel Plot Assessment on Meta-Analysis Outcomes
- Home
- Insights
- Article
- Impact of Funnel Plot Assessment on Meta-Analysis Outcomes
Qualitative Research Service
- Understanding the Purpose of Funnel Plot Assessment
- Role of Funnel Plot and Publication Bias Detection
- Importance of Funnel Plot Interpretation in Research Analysis
- Funnel Plot and Egger Test for Statistical Bias Evaluation
- Funnel Plot Assessment Example in Evidence Synthesis
- Impact of Asymmetrical Funnel Plot on Research Outcomes
- Advantages of Funnel Plot Evaluation in Meta-Analysis Services
- Challenges and Limitations of Funnel Plot Evaluation
- Conclusion
News & Trends
Recommended Reads
Contact us
Introduction
- 1. Understanding the Purpose of Funnel Plot Assessment
- 2. Role of Funnel Plot and Publication Bias Detection
- 3. Importance of Funnel Plot Interpretation in Research Analysis
- 4. Funnel Plot and Egger Test for Statistical Bias Evaluation
- 5. Funnel Plot Assessment Example in Evidence Synthesis
- 6. Impact of Asymmetrical Funnel Plot on Research Outcomes
- 7. Advantages of Funnel Plot Evaluation in Meta-Analysis Services
- 8. Challenges and Limitations of Funnel Plot Evaluation
- 9. Conclusion
Meta-analysis is one of the most effective methods of statistics, which combines independent results obtained from different studies. The use of meta-analysis allows obtaining strong evidence, making better decisions, and improving accuracy in research. Nonetheless, it is necessary to pay attention to the balance, lack of biases, and reliability of the included studies because these factors play a crucial role in meta-analysis. It is in this respect that funnel plot evaluation plays an essential part [1].
Funnel plot evaluation in meta-analysis allows detecting publication biases, study heterogeneity, and small-study effects. The application of funnel plots in meta-analysis is common practice for fields like healthcare, medical sciences, psychology, business studies, pharmaceutical analysis, and social sciences. The examination of the scatter of data enables researchers to conclude about the scientific credibility of meta-analysis outcomes.
The growth of interest to evidence-based research makes funnel plot meta-analysis a mandatory element of systematic reviews and meta-analysis services.
In today’s highly competitive and data-oriented world, organizations have to move past just gathering information and begin to analyse information in such a manner as to draw insights from their findings. Likert scale surveys allow an organization to gather opinions, gauge levels of satisfaction, and even determine behavioural intentions of its audience. The importance of Likert scale surveys comes not only in creating surveys but doing so effectively. [1]
Understanding the Purpose of Funnel Plot Assessment
What Is a Funnel Plot in Meta-Analysis?
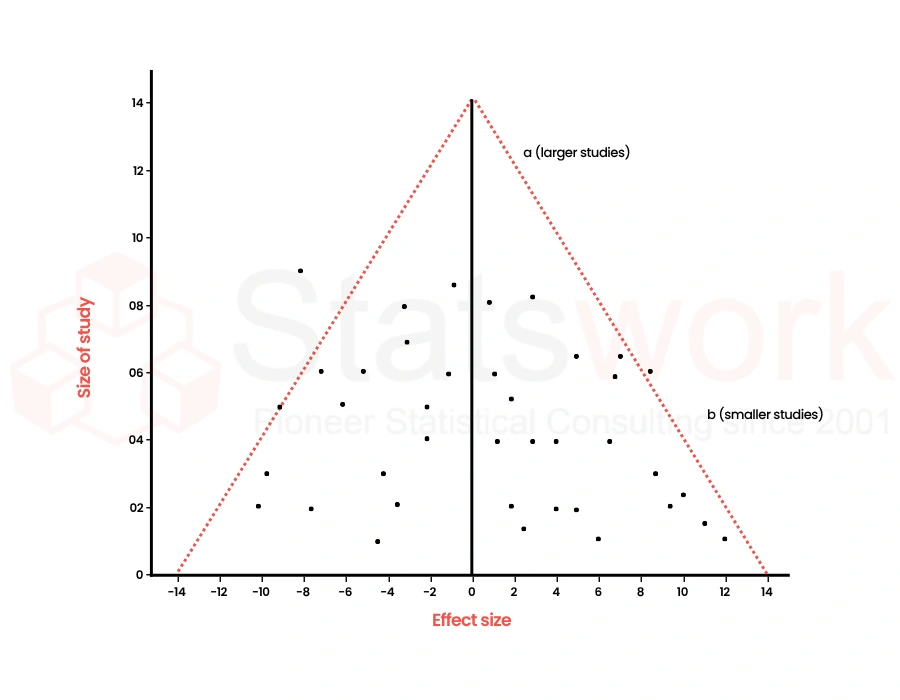
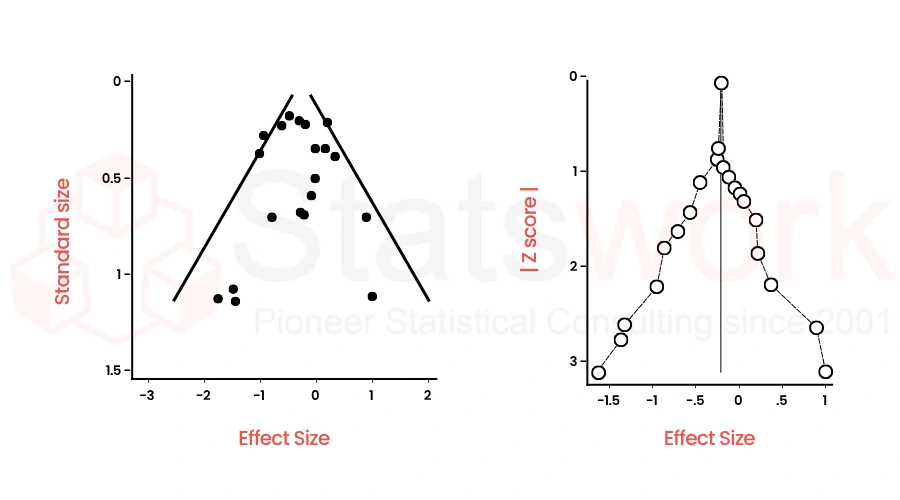
A funnel plot is a graphical representation utilized in meta-analysis to contrast the effect sizes of studies with their degree of precision. Large studies are typically located at the top of the chart since they exhibit less variability than small studies that can be found at the bottom of the graph.
When there is no bias in the study results, the plots will take on an inverted funnel shape. When there is missing data or bias within the results, the funnel plot will deviate from the expected shape [2].
The use of a funnel plot template is common when performing systematic reviews and evidence syntheses.
Role of Funnel Plot and Publication Bias Detection
Why Publication Bias Matters in Meta-Analysis
Publication bias entails that publications with statistically significant or positive results are more frequently published than studies that do not have any significant findings. This phenomenon affects the balance of scientific literature and may cause erroneous results from meta-analysis.
As is clear from the above information, the connection between funnel plot and publication bias plays a key role in the process of conducting research. With the help of this method, researchers can determine whether the sample contains small or non-significant studies.
If there are studies with negative results left unpublished, there is no symmetrical distribution of data in a funnel plot, thus indicating the absence of studies with non-significant findings. It may be caused by publication bias [3].
It is very important to find publication bias when working with medical studies since wrong conclusions may influence patient treatment and development of policies.
Importance of Funnel Plot Interpretation in Research Analysis
How Researchers Interpret Funnel Plot Symmetry
A proper analysis of a funnel plot is required to judge the reliability of results obtained by pooling data from various studies. A proper analysis of a funnel plot is required to judge the reliability of results obtained by pooling data from various studies.
The following interpretations are commonly applied:
| Funnel Plot Pattern | Explanation |
| Symmetric Funnel Shape | Supports lower chances of publication bias |
| Slight Asymmetry | Suggests the presence of heterogeneity or small-study effect |
| Asymmetry | May imply publication bias or missing studies |
| Study Dispersion Is Wide | Speaking of high variance amongst studies considered |
| Large Studies Grouped Together | Speaks to higher preciseness and consistency |
However, while asymmetry suggests possible publication bias, there is a need to look for other possible reasons for asymmetry in results that may arise from methodology, samples, quality of the study, among others [4].
Proper interpretation needs both statistical and substantive understanding of the studies in question.
Funnel Plot and Egger Test for Statistical Bias Evaluation
Combining Visual and Statistical Bias Assessment Methods
Funnel plot and Egger regression testing methodologies are typically used in combination by researchers to increase the effectiveness of bias detection in meta-analyses.
Whereas the former methodology visually presents an array of studies, the latter statistically supports the presence of asymmetry. The significance of the test is to check if there is a correlation between the magnitude of effect and study accuracy.
Significance of the Egger test can be indicative of such biases as:
- Publication bias
- Small study effects
- Selective reporting
- Inconsistent methodology
Combination of the two methodologies mentioned increase’s reliability of evidence synthesis and minimizes risks of misleading interpretations.
Such an approach is common in pharmaceutical studies, epidemiology research, and in systematic reviews of high level.
Funnel Plot Assessment Example in Evidence Synthesis
Practical Example of Funnel Plot Analysis
Funnel plot analysis can be used to understand how publication bias impacts meta-analysis results.
For instance, let’s say that a meta-analysis is conducted on a novel medical therapy. The problem arises where only research indicating positive results for medical therapy is published. As such, the small-scale research that did not have positive results remains unpublished [3].
In such a scenario, the funnel plot ends up being asymmetric because there are no publications on the other side of the plot. As such, there is an overestimation of the pooled effect size.
Conversely, in the scenario where there is equal representation of both negative and positive studies, the funnel plot assumes the shape of a symmetric funnel. Funnel plot analysis examples are usually applied in academic learning settings, statistical reporting, and research methodology seminars.
Impact of Asymmetrical Funnel Plot on Research Outcomes
Understanding the Risks of Funnel Plot Asymmetry
Asymmetrical funnel plots are considered critical indicators within the realm of evidence synthesis studies. This implies that the studies used within the analysis do not entirely encompass the totality of evidence available.
Some possible implications of asymmetry could be as follows:
- Exaggeration of the effectiveness of treatments
- Decreased accuracy of pooled outcomes
- Invalid research findings
- Higher chances of biased recommendations
- Inferior quality of evidence in systematic reviews
Nevertheless, one should refrain from viewing asymmetry as a direct result of publication bias exclusively. Some other reasons that could be responsible for funnel plot asymmetry include:
- Differences in study designs
- Methodological inconsistencies
- Population variations
- Variability in intervention impacts
Conclusively, proper interpretation is imperative for scientifically sound findings.
Advantages of Funnel Plot Evaluation in Meta-Analysis Services
Major Advantages of Funnel Plot Evaluation
There are several benefits of the funnel plot evaluation when it comes to meta-analyses and systematic reviews [4].
Major Advantages:
- Ability to detect publication bias in pooled studies
- Assessment of study reliability and consistency
- Detection of small study effects
- Enhancement of the clarity of evidence
- Improvement of research results credibility
- Conducting more sophisticated sensitivity analyses
- Better understanding of statistical heterogeneity
- Evidence-based decision making
That is why funnel plot evaluation has become such a crucial component of contemporary research methodology.
Challenges and Limitations of Funnel Plot Evaluation
Researchers Should Not Forget About
Although the funnel plot is a very useful tool, there are some limitations of this technique as well.
First, a funnel plot cannot be used when the meta-analysis involves a very small number of studies. Ten studies are typically required for a proper funnel plot evaluation.
Some other limitations of this method include:
- A subjective interpretation of the results
- The difference between heterogeneity and bias
- The impact of the different levels of study quality
- Accuracy issues with extremely heterogeneous data
- Effect of sample sizes on analysis
These challenges can be addressed by combining funnel plot interpretation with other statistical techniques [3].
Conclusion
Funnel plot assessment is vital in enhancing the precision and credibility of meta-analysis results. It helps the researcher to identify any bias and inconsistency in the study through analyzing publication bias, funnel plot analysis, and evaluating small-study effects.
The combination of funnel plot assessment, Egger regression analysis, and publication bias assessment makes the process of systematic review rigorous in yielding reliable research findings. In clinical trials, healthcare investigation, pharmaceutical assessment, and social sciences among others, funnel plot assessment forms part of highly important tools for meta-analysis [4].
In future, with the advancement of evidence synthesis, it would be critical to have proper funnel plot assessment in yielding scientifically sound research findings. With professional Meta-Analysis Services offered by Statswork, researchers will receive reliable assistance regarding funnel plot analysis, publication bias evaluation, and Egger test.
Reference
- Simmonds, M. (2025). Quantifying the risk of error when interpreting funnel plots. Systematic reviews, 4(1), 24. https://link.springer.com/article/10.118
- Afonso, J., Ramirez-Campillo, R., Clemente, F. M., Büttner, F. C., & Andrade, R. (2024). The perils of misinterpreting and misusing “publication bias” in meta-analyses: an education review on funnel plot-based methods. Sports medicine, 54(2), 257-269. https://link.springer.com/article/10.10
- Terrin, N., Schmid, C. H., & Lau, J. (2024). In an empirical evaluation of the funnel plot, researchers could not visually identify publication bias. Journal of clinical epidemiology, 58(9), 894-901. https://www.sciencedirect.com/
- Mayer, E. K., Bottle, A., Rao, C., Darzi, A. W., & Athanasiou, T. (2023). Funnel plots and their emerging application in surgery. Annals of surgery, 249(3), 376-383. https://journals.lww.com/annals