
- Services
- Data Analysis services
- Sample Work
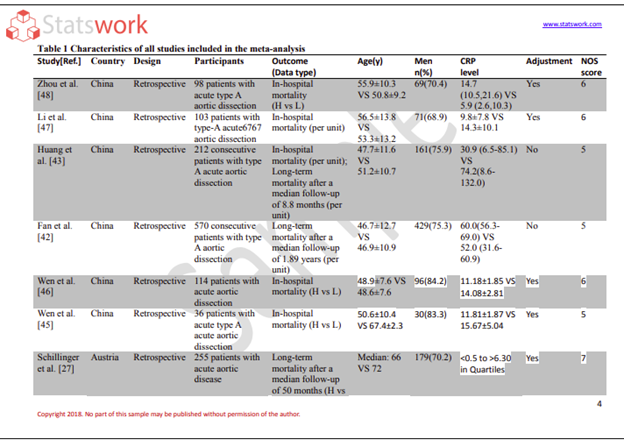
Data Analysis services
- Secondary Qualitative Research Services
- Secondary Quantitative Research Services
- Meta-Analysis Research services
- Sample Work
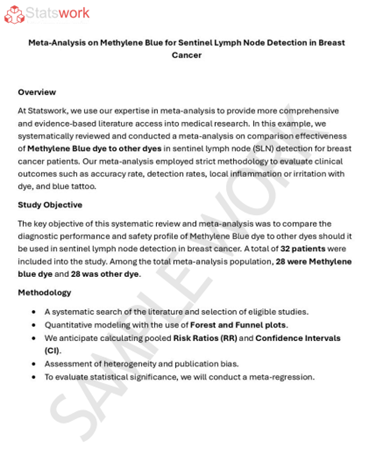
Meta-Analysis Research Services
- Data Collection Services
- Sample Work
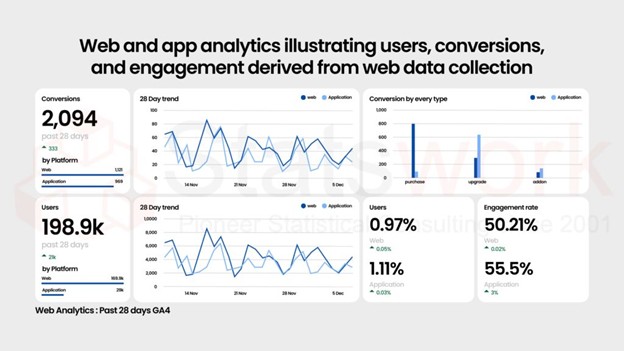
Data Collection Services
- Statistical & Biostatistics services
- Sample Work
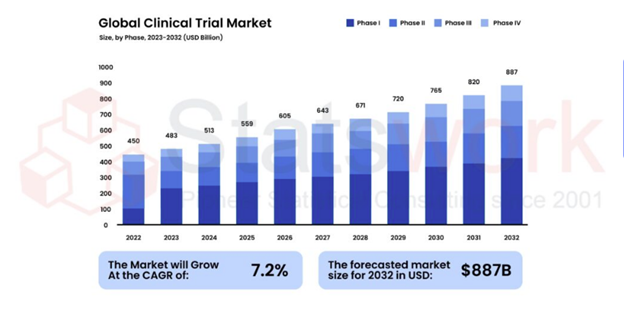
Statistical Programming & Biostatistics services
- Data Management Services
- Sample Work
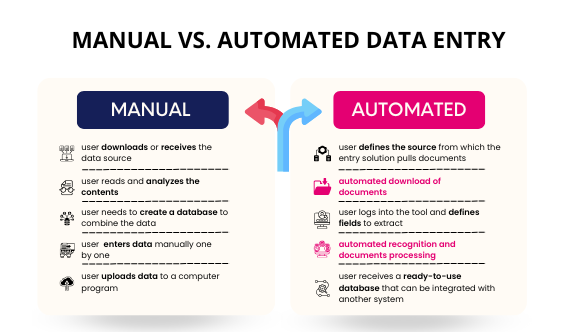
Data Management Services
- Research methodology services
- Sample Work
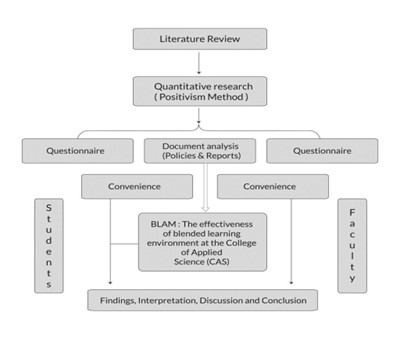
Research methodology services
- Tool Development Services
- Sample Work
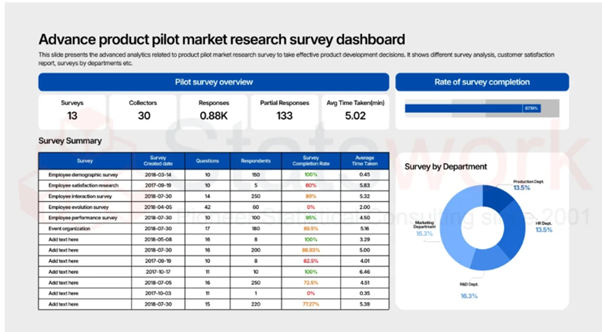
Tool development services
- Statistical Interpretation services
-
Statistical Interpretation services
- Sample Work
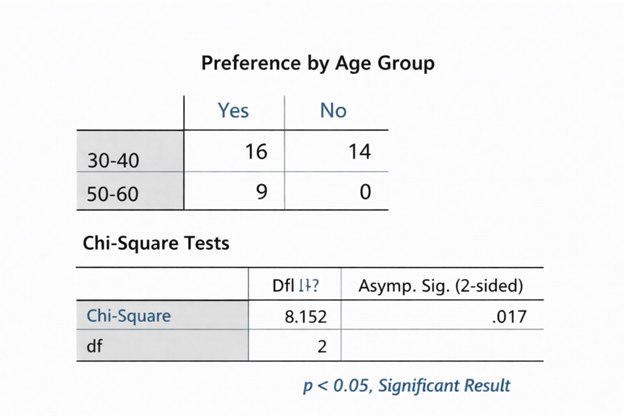
Statistical Interpretation services
-
- Sample Size Calculation Services
-
Sample Size Calculation Services
- Sample Work
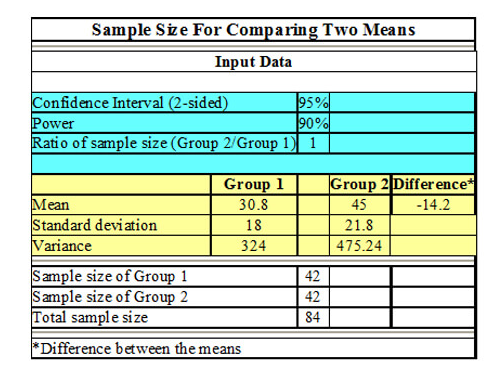
Sample Size Calculation Services
-
- AI & ML Services
-
Artificial Intelligence and Machine Learning Services
- Sample Work
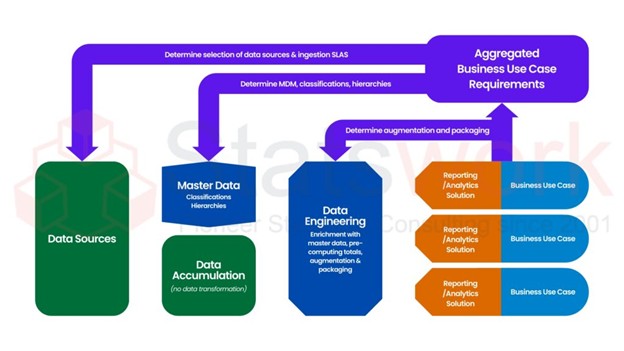
Artificial Intelligence and Machine Learning Services
-
- Meaningful Visualization Services
- Thought Leadership Services
- Report Generation Services
-
Report generation Service
- Sample Work
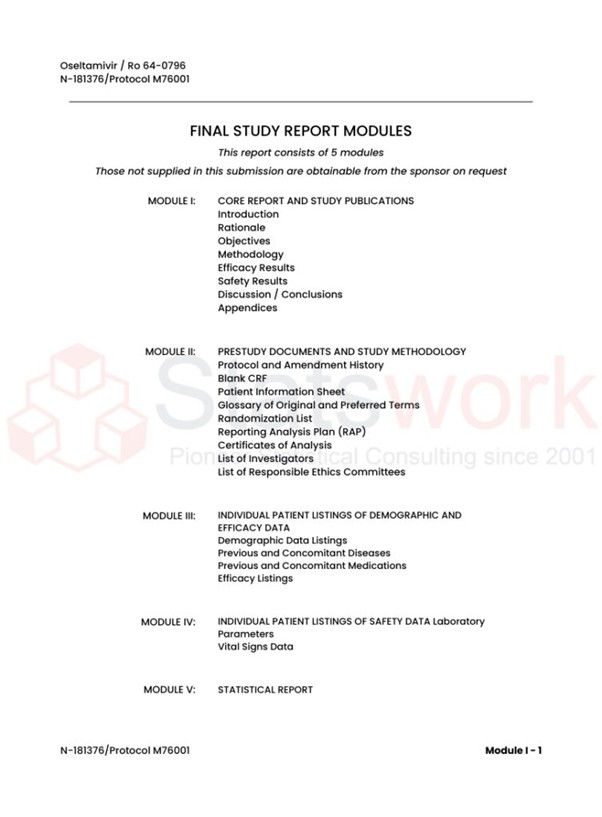
Report generation Services
-
- Data Analysis services
- Industries
- About Us
- Blog
- Insights
- Contact Us
- Services
- Data Analysis services
- Sample Work
Data Analysis services
- Secondary Qualitative Research Services
- Secondary Quantitative Research Services
- Meta-Analysis Research services
- Sample Work
Meta-Analysis Research Services
- Data Collection Services
- Sample Work
Data Collection Services
- Statistical & Biostatistics services
- Sample Work
Statistical Programming & Biostatistics services
- Data Management Services
- Sample Work
Data Management Services
- Research methodology services
- Sample Work
Research methodology services
- Tool Development Services
- Sample Work
Tool development services
- Statistical Interpretation services
-
Statistical Interpretation services
- Sample Work
Statistical Interpretation services
-
- Sample Size Calculation Services
-
Sample Size Calculation Services
- Sample Work
Sample Size Calculation Services
-
- AI & ML Services
-
Artificial Intelligence and Machine Learning Services
- Sample Work
Artificial Intelligence and Machine Learning Services
-
- Meaningful Visualization Services
- Thought Leadership Services
- Report Generation Services
-
Report generation Service
- Sample Work
Report generation Services
-
- Data Analysis services
- Industries
- About Us
- Blog
- Insights
- Contact Us
How to combine qualitative and quantitative techniques? Expand the scope and analytic power
Meta Analysis Service
- Why Combine Qualitative and Quantitative Research?
- What Is a Mixed Methods Design?
- How Does Qualitative and Quantitative Integration Work?
- Triangulation: Turning Two Evidence Streams into One Insight
- Common Challenges and How to Handle Them
- When Should You Use a Mixed Methods Approach?
- Final Takeaway
Recommended Reads
Contact us
Summary:
The use of quantitative and qualitative research enables the researcher to get not only a knowledge of how something is going but also why it is going on. The information collected quantitatively gives certain patterns, and qualitative analysis brings additional insight into them. There are different kinds of mixed method designs (convergent design, sequential design, etc.) that depend on the research question posed. The combination of data via sampling, collection, analysis and triangulation allows the researcher to obtain more accurate results. This technique is useful in such fields as healthcare, marketing, education, public health, product research, and many others.
A research question is seldom simple. Statistics can help you know what is going on, but experience will tell you why it is going on. That is the strength of mixed methods of research; it combines numbers and people in a single research project.
Why Combine Qualitative and Quantitative Research?
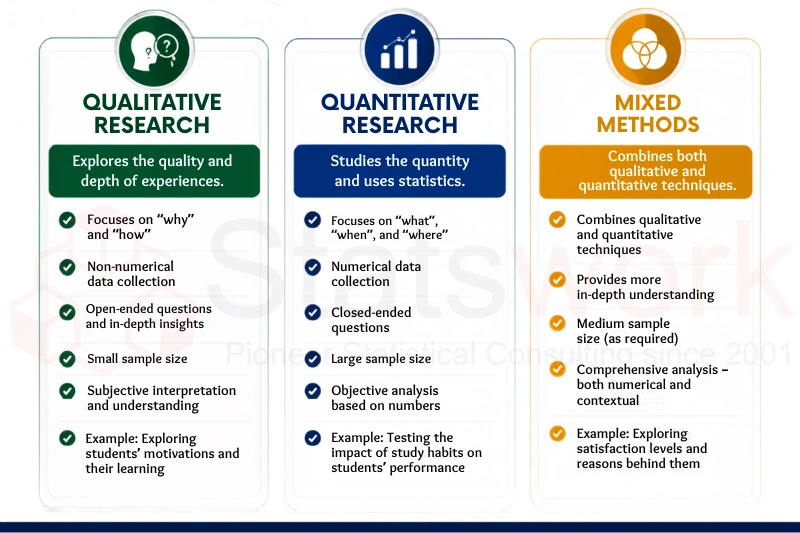
The qualitative approach records opinions, motivation, experience, and perception by means of conducting interviews, focus group, observation, or open response questions. The quantitative approach uses measurements and variables, conducts surveys and experiments, and applies statistics to establish patterns [1].
Qualitative and quantitative research combined can prove useful when one form of evidence by itself is insufficient to address the research question in its entirety.
| Qualitative Research | Quantitative Research | Value when used together |
| Why and how something happens | What, how many, or how often it happens | Provides an explanation of patterns and causes |
| Provides context and experience | Enables statistical analysis | Provides more context to numerical data |
| Involving interviews and open-ended questions | Involves surveys and experimentation | Links experience to patterns |
Real-World Example:
Consider a situation where a hospital observes a decline in patient satisfaction from 88% to 76%. The problem is established in numbers, yet the reason behind is not known. Interviews conducted among the patients will help find out that long waiting hours, poor communication, and difficulty in scheduling appointments are often mentioned.
Numbers reveal the problem, but the discussion reveals the reason behind it.
What Is a Mixed Methods Design?
The mixed methods design is the research design structure, which specifies when, where, and how qualitative and quantitative data will be collected, analyzed, and combined. The research design should depend on the research question, not just on the researcher’s intention to combine two different research methods [2].
Some of the most common research designs are:
- Convergent design – both sets of data are collected in the same period, then are analyzed separately and later compared and combined.
- Explanatory sequential design – quantitative results are first, after which qualitative research is conducted to explain some significant results of the previous stage.
- Exploratory sequential design – qualitative results come first and contribute to the development of a survey or measuring instrument for quantitative research.
- Embedded design – one research method complements another in the research process.
How Does Qualitative and Quantitative Integration Work?
A combination of both qualitative and quantitative research methods has its effectiveness in the integration process, not in gathering two sets of data [3].
1. Sampling
There is a possibility to choose different approaches to sampling for every part of the research.
For instance, one may use probability sampling for conducting a consumer preference survey and purposive sampling for interviewing selected consumers.
2. Data Collection
The questionnaire can be designed in such a way that there will be both closed questions to analyze numerically and open questions for the respondent to provide explanation for his/her answers.
For instance, while examining online learning, one may ask the respondents to rate the level of satisfaction on the scale from 1 to 5 and to give their answer to the question “What is your biggest problem in the course?”. Thus, a quantitative indicator and a qualitative explanation will be obtained.
3. Data Analysis
Both sets of data may be analyzed using appropriate methods and then combined.
| Point of integration | Examples | Benefits |
| Sampling | Conduct survey interviews; conduct interviews among sample | Combines breadth with depth |
| Collecting | Use rating scales and open-ended questions | Gathers both numbers and reasons |
| Analyzing | Statistical results and themes | Co-discovery of complementary insights |
| Interpreting | Conduct a side-by-side comparison | Enables better conclusions |
Triangulation: Turning Two Evidence Streams into One Insight
Triangulation enables the comparison of results generated from different research approaches to establish whether they are supporting or contradicting each other.
For example, if a retail brand wants to explore the reasons for online shopping cart abandonment, analytics may indicate that this occurs mostly when paying. Interview data may suggest that people get confused due to the additional shipping cost.
If both approaches indicate the same reason, it makes the result more reliable. If, on the other hand, they do not agree, it does not mean that something goes wrong – quite on the contrary!
Common Challenges and How to Handle Them
However, it is possible to produce better outcomes through the combination of methods; still, this needs to be approached with caution.
Researchers should pay attention to the following issues:
- Imbalance in weighting: Determine if both data sets are equally important and one reinforces another.
- Contradictory results: Do not try to make results fit. Explore the reasons why the evidence does not match.
- Bad integration: The analysis of two data sets without their combination reduces the validity of the research.
- High costs: This kind of research can be more demanding in time, skill, number of participants and analysis.
- Ambiguity in the research questions: Identify the contribution of each technique before gathering data.
A well-formulated research plan and clear strategy of integration can help in this case.
When Should You Use a Mixed Methods Approach?
This method is especially valuable in cases where researchers require empirical evidence.
It can be effective in:
- Research in healthcare on the effectiveness of treatment and patients’ experience
- Research in marketing about customers’ behavior and motivation
- Research in education about learning outcomes and students’ perceptions
- Research in public health on behavioral trends and communities’ experiences
- Research in product use and feedback from users
For instance, the results of an examination can show at a university that the performance of some students in a certain class is poor. Interviewing them may show that the problem is not the complexity of the material but the speed of teaching.
Final Takeaway
It is the ability to ask smarter questions of the evidence that makes the strength of the combined methodologies. Quantitative evidence may provide an indication of scale, frequency, and relationship whereas qualitative evidence provides motivation, experience, and context. By integrating these pieces of evidence in Data Analysis , it becomes possible for researchers to go beyond individual pieces of evidence to draw meaningful conclusions.
An effective study is not one which uses many methodologies but one where appropriate methodology are used for research questions and their findings are logically connected. To find out more, please refer to our Statswork’s page.
Frequently Asked Questions (FAQs)
Qualitative and quantitative research can be combined by collecting and analysing both numerical data and descriptive insights within the same study. Researchers then integrate the findings to gain a more complete understanding of the research question.
A mixed methods approach combines qualitative and quantitative research with analytics to understand both customer behaviour and the reasons behind it. This helps marketers make data-driven decisions while considering customer needs and motivations.
Using both qualitative and quantitative approaches is called mixed methods research. It combines numerical evidence with detailed perspectives, experiences, or opinions to provide deeper research insights.
A mixed methods design integrates qualitative and quantitative methods within a single research study. It allows researchers to compare, connect, or combine findings from both types of data.
The seven common types are phenomenology, ethnography, grounded theory, case study, narrative research, action research, and historical research. For example, ethnography may explore workplace culture, while phenomenology may examine patients’ experiences.
Quantitative classroom data could include students’ test scores, attendance percentages, or assignment grades. Qualitative data could include student interviews, teacher observations, or written feedback about learning difficulties.
References:
- Johnson, R. B., & Onwuegbuzie, A. J. (2004). Mixed Methods Research: A Research Paradigm Whose Time Has Come. Educational Researcher, 33(7), 14–26. https://journals.sagepub.com/doi/10
- Fetters, M. D., Curry, L. A., & Creswell, J. W. (2013). Achieving Integration in Mixed Methods Designs—Principles and Practices. Health Services Research, 48(6 Pt 2), 2134–2156. https://onlinelibrary.wiley.com/doi
- Sandelowski, M. (2000). Combining qualitative and quantitative sampling, data collection, and analysis techniques in mixed-method studies. Research in Nursing & Health, 23(3), 246–255. https://onlinelibrary.wiley.com