Celebrate the season with exclusive savings from Statswork!


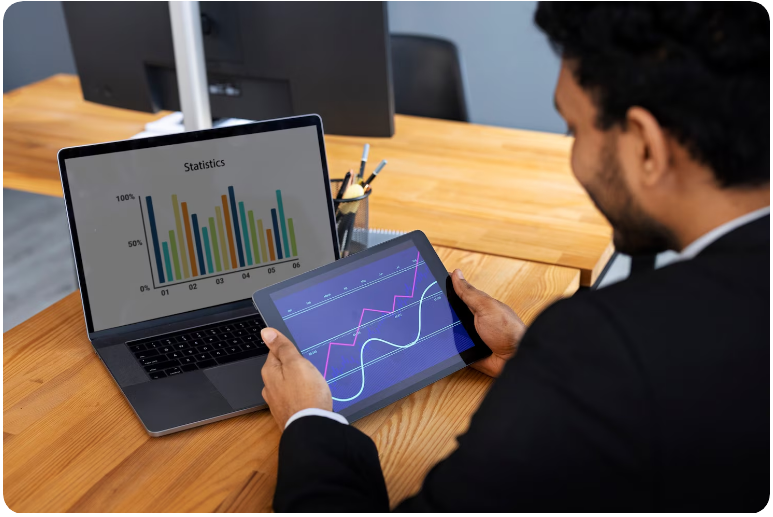
Design of interactive dashboards
We design powerful, user-friendly dashboards that allow users to easily explore large amounts of data and monitor key performance indicators with minimal effort.

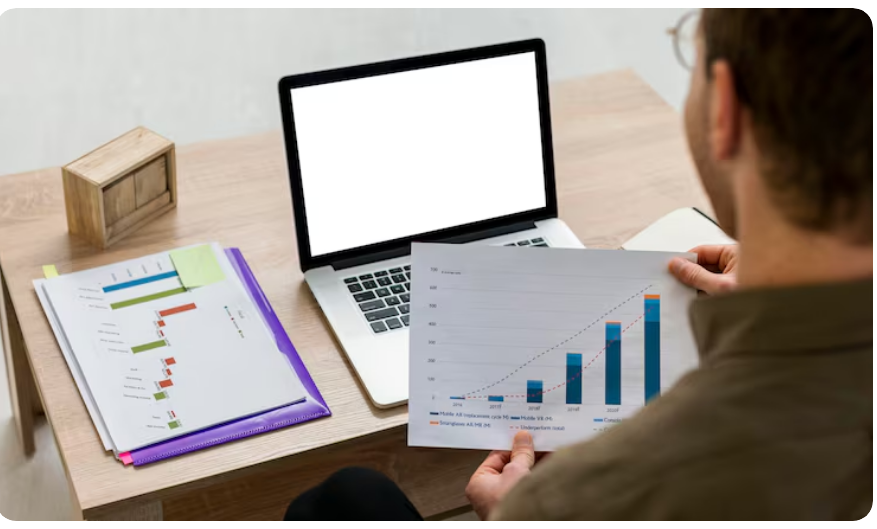
Advanced Data Charting & Analysis
We produce a wide variety of beautiful and effective graphics and charts that allow end-users to quickly identify patterns, significant differences, or important takeaways relating to the data being analyzed.
Custom Reporting & Visual Storytelling
We turn raw data into concise and visually appealing report cards or storyboards, enabling decision-makers to make better decisions based on high-level views of the data. stakeholders to make informed and rational decisions.

Data Cleanup & Visualization Preparation
We assist clients in cleaning up, structuring, and preparing their datasets in such a way that they can be used accurately and effectively for high-quality and market-ready data representations.


1. Know the Requirements
- Determine the needs of the business by defining their key objectives, metrics, and what decisions they are trying to make.
- Understand who will be looking at the visualization, why they are looking at it, and the context in which they will be looking at it.

2. Data Quality
- Prepare the data by removing, formatting, and validating the data from the raw data sources.
- The data should be in a consistent format to allow for easy visualization.

3. Visualization Design and Development
- Design and produce graphs, dashboards and other visual representations of data in line with the analysis objectives.
- Visualizations should be designed according to best-practice design guidelines, so that they are easily readable, clear and impactful.

4. Extract and Align the Insights
- Capture and display the key trends, patterns and insights that are important to the business.
- Ensure that visualizations are made to support both strategic and operational decision making.

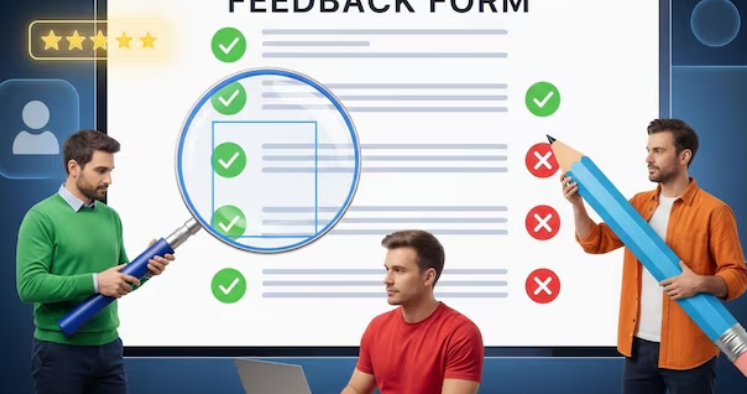
5. Review, Test and Revise
- Perform a series of iterative reviews of the visualizations, in order to verify that they are accurate and usable.
- Visualizations should also be optimized for presentation, reporting and stakeholder communication.
6. Support and Final Delivery
- Delivery finalized and ready to use visualizations, dashboards and reports, and other packs of graphics.
- Provide ongoing support for interpreting, updating and integrating visualizations.