


What are different types of data analysis and statistics applied for Political Campaigns?
February 4, 2021
What are the different methodological advancements in productivity and efficiency analysis?
February 16, 2021How to measure Technical efficiency in the port industry: Best Possible guidelines – Statswork
In-Brief
- This blog elaborates some of the most commonly used Technical Efficiency Analysis in the port industry, like Parametric, with Stochastic Frontier Analysis (SFA), Nonparametric, with Data Envelopment Analysis (DEA).
- It describes some of the steps which help in increasing the port efficiency at the planning stage.
Introduction
Ports offer numerous service activities related to cargo, vessels and inland transport. The degree of satisfaction gained by the shippers expresses the level of port performance achieved. Hence, the port must provide high satisfactory services to the ocean liner and at the same time managed to provide optimal infrastructure based on the vessel type (ocean liner) and cargo they need to handle. Thus the port performance needs a set of measures associated with the vessels to stay at port, rate of loading and unloading the cargo and the quality storage and inland transport. Therefore, a strong relationship always exists between these set of measures and numerous port performance indicators—technical Efficiency Data Analysis helps examine each port’s performance based on some essential aspects.
Port performance indicators
There are various indicators which help in measuring the port performance. Absence of a general standard for data collection collaborated with limited data availability often limits the expansion of a port’s performance dashboard. Some of the most popularly used indicators include the following:
- Container dwell time: Throughput speed or how long a vessel stopovers a port or extensions. Simultaneously, the dwell time concept has been primarily used in port operation, which is now being applied in other contexts, like passenger transports.
- Voyage productivity: how rapidly a port loads and unloads the containers
- Container traffic: vessel/cargo throughput at a terminal
- Truck visit time: time spent by trucks inside the terminal to deliver/pick up a container
The various methodology used to measure Port Efficiency
Port efficiency analysis establish a relationship between input and outputs. The input represents the main physical facilities in port’s and its labour force and outputs represent quantities or activities/movements in ports. So, it is always essential to estimate a production or cost frontier that is the set of maximum outputs given at various levels of inputs or the set of minimum inputs given at various outputs. In this framework, the production frontier indicates the optimal combination of inputs in a particular industry. Thus, a manufacturer is considered inefficient if incase it perform beneath the frontier. The efficiency can be estimated as the gap between the position allocated to each observation, which is purely based on the relationship between its inputs and outputs – and the estimated best performs located on the production frontier. The following, two different statistical efficiency data analysis approaches are being used to construct an efficient frontier,
- Parametric, with Stochastic Frontier Analysis (SFA),
- Nonparametric, with Data Envelopment Analysis (DEA)
Both of these methodologies are proven to be useful for conducting an efficient analysis. They offer necessary information on port or terminals, whether they are employing their inputs appropriately, thus making appropriate investments.
Data Envelopment Analysis (DEA) to measure the relative efficiency of a sample of ports and cluster analysis to survey their organizational structures. Their results help as a guide for governments, port managers and port owners on the various aspects in which they can construct their ports to lead to greater efficiency. The DEA approach used to evaluate the relative efficiency of the sample ports. It is an established statistical analysis in research that calculates the relative efficiency of where simple efficiency measures are hard to obtain.
The main advantage found in DEA is that it can handle numerous inputs and outputs. The DEA analysis units are homogeneous and independent, and it is generally used where there are a huge number of units providing an ‘identical’ service in relative isolation. It is successfully used in research airports, courts, local government authorities, hospitals, bank branches and general medical practitioners to test efficiency. There are multiple centres of inputs and outputs found. Its application to the port industry would therefore appear to be ideal. However, only a few studies involve seaports using DEA. Martinez-Budria et al. (1999) and Tongzon (2001) are two studies using Spanish and Australian ports. Roll and Hayuth (1993) in a hypothetical study, state that DEA is the most suitable tool for measuring port efficiency.
SFA signifies a parametric approach that considers the existence of a statistical function and allows for hypothesis testing. It provides advanced statistical analysis to increase the performance of the port.
The following three steps help in increasing the port efficiency at the planning stage.
- Consider the boundary conditions
A port planner needs to consider various boundary conditions, such as space for the pier operator for cargo management, transportation, facilities, and space needed by the vessels for bypassing and turning, and so on. It considers various environmental aspects, like aiming for a calm harbour basin, breakwaters, which try to decrease currents and if possible, have the quay lying in a direction wind will push the moored vessel into the fenders. These aspects will reduce vessel motions. Smaller vessel motions mean advanced terminal efficiency.
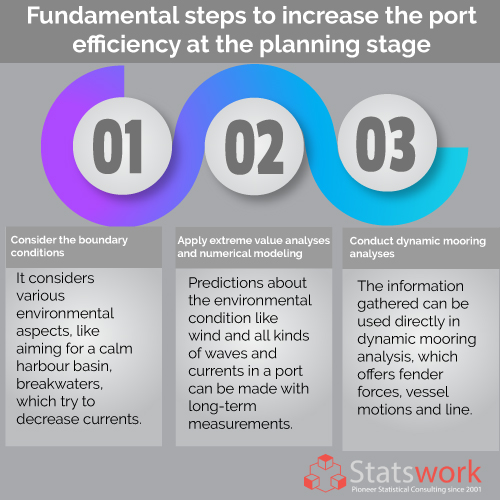
- Apply extreme value analyses and numerical modelling
Predictions about the environmental condition like wind and all kinds of waves and currents in a port can be made with long-term measurements and numerical modelling, disturbing berthing conditions. For example, prolonged waves (swell, long fetch lengths, passing vessels) can decrease terminals’ operability. With extreme value analyses, a port planner would predict how frequently each condition is likely to occur.
- Conduct dynamic mooring analyses
The information gathered from the above can be used directly in dynamic mooring analysis, which offers fender forces, vessel motions and line. With these tools’ help, meteorological and hydrodynamic information in a test matrix can be combined freely. The effect of passing vessels can be integrated, and one can consider that waves and currents can be varied over the entire vessel length.
Moor analysis
It is an extremely quick tool that permits testing an entire matrix within a batch, allowing exceptionally precise insight into vessel motions that need to be expected in the port design. It helps in predicting port downtimes and can examine different considerable designs. It tests how efficiently a port can be optimized by choosing the design that gives the lowest downtimes. With this tool’s support, one can quickly imagine how quickly a few per cent will pay off already.
Conclusion
Understanding performance is the fundamental concept in any business, whether it is about measuring achievements against set objectives and goals or, against the competition. Which is not exceptional to ports, and only through comparison performance can be evaluated.
Ports are a complex business with different inputs and outputs, making the direct comparison difficult among homogeneous ports. The subject is further complex by the various types of port ownership and organizational structures found throughout the world. Statistical analysis in research helps measure the efficiency of the port if you have difficulty with the statistical analysis, you can get help from online Survey Data Analysis services help providers.
Reference
- Metalla, O., Vyshka, E., & Lumi, D. (2015). Defining the most important port performance indicators: a case of Albanian ports. ISSN, 2348(0386), 16-28.
- Valentine, V. F., & Gray, R. (2001, July). The measurement of port efficiency using data envelopment analysis. In Proceedings of the 9th world conference on transport research (Vol. 22, p. 27). South Korea: Seoul.