
- Services
- Data Analysis services
- Sample Work
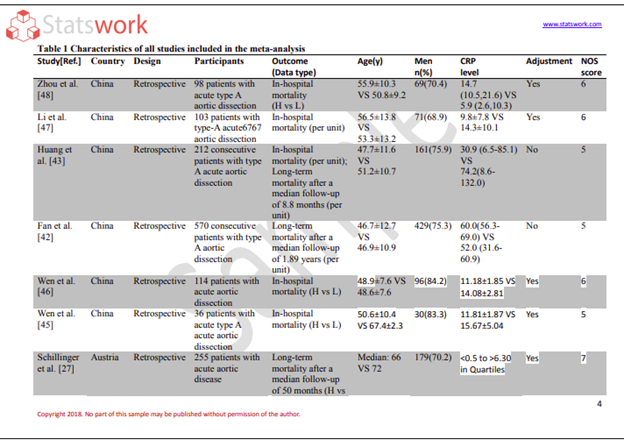
Data Analysis services
- Secondary Qualitative Research Services
- Secondary Quantitative Research Services
- Meta-Analysis Research services
- Sample Work
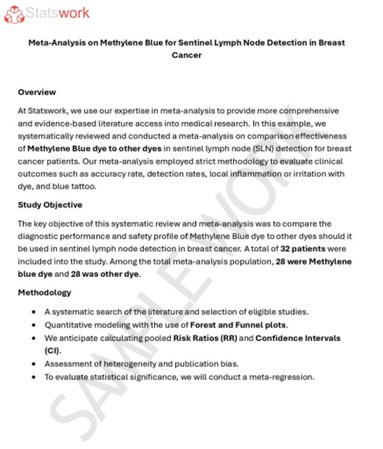
Meta-Analysis Research Services
- Data Collection Services
- Sample Work
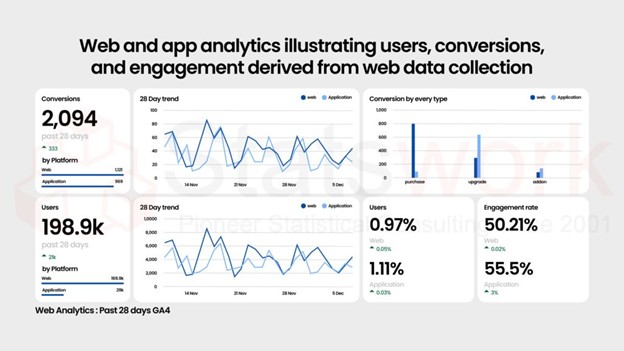
Data Collection Services
- Statistical & Biostatistics services
- Sample Work
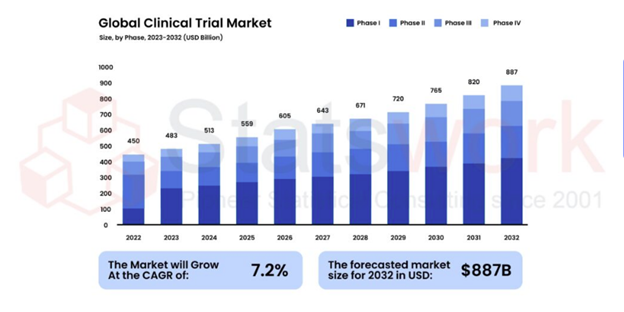
Statistical Programming & Biostatistics services
- Data Management Services
- Sample Work
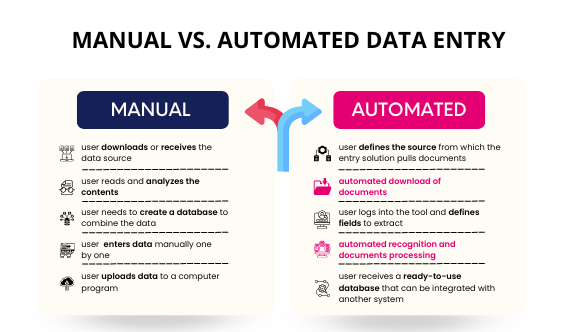
Data Management Services
- Research methodology services
- Sample Work
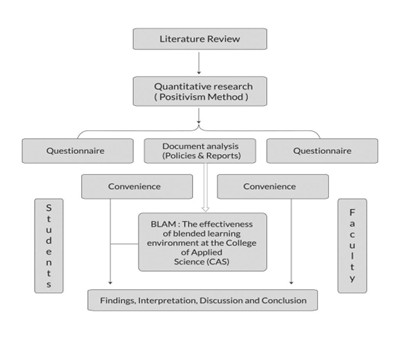
Research methodology services
- Tool Development Services
- Sample Work
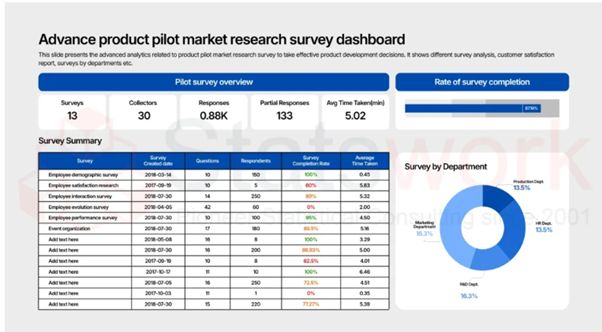
Tool development services
- Statistical Interpretation services
-
Statistical Interpretation services
- Sample Work
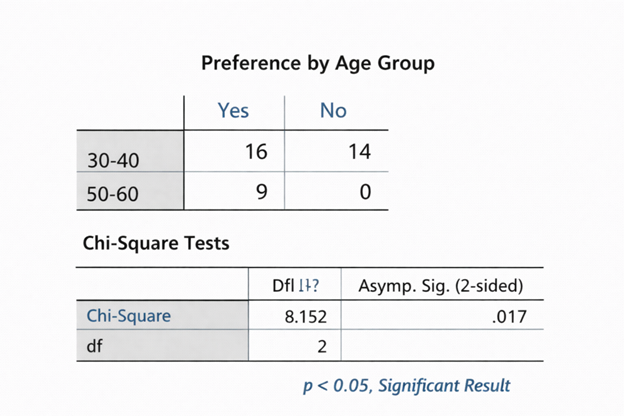
Statistical Interpretation services
-
- Sample Size Calculation Services
-
Sample Size Calculation Services
- Sample Work
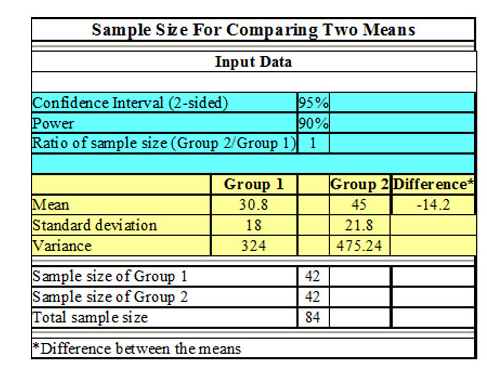
Sample Size Calculation Services
-
- AI & ML Services
-
Artificial Intelligence and Machine Learning Services
- Sample Work
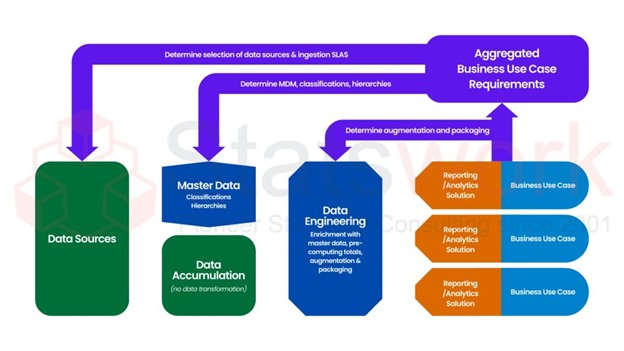
Artificial Intelligence and Machine Learning Services
-
- Meaningful Visualization Services
- Thought Leadership Services
- Report Generation Services
-
Report generation Service
- Sample Work
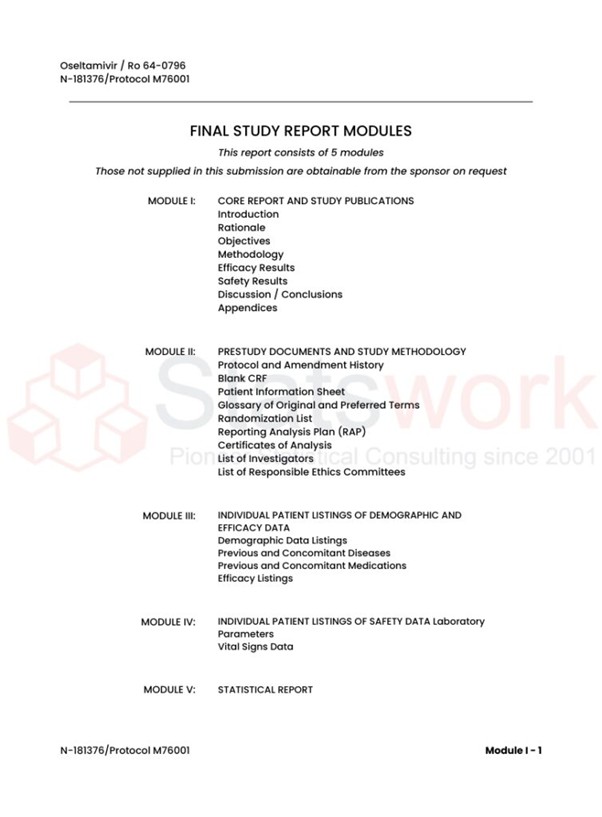
Report generation Services
-
- Data Analysis services
- Industries
- About Us
- Blog
- Insights
- Contact Us
- Services
- Data Analysis services
- Sample Work
Data Analysis services
- Secondary Qualitative Research Services
- Secondary Quantitative Research Services
- Meta-Analysis Research services
- Sample Work
Meta-Analysis Research Services
- Data Collection Services
- Sample Work
Data Collection Services
- Statistical & Biostatistics services
- Sample Work
Statistical Programming & Biostatistics services
- Data Management Services
- Sample Work
Data Management Services
- Research methodology services
- Sample Work
Research methodology services
- Tool Development Services
- Sample Work
Tool development services
- Statistical Interpretation services
-
Statistical Interpretation services
- Sample Work
Statistical Interpretation services
-
- Sample Size Calculation Services
-
Sample Size Calculation Services
- Sample Work
Sample Size Calculation Services
-
- AI & ML Services
-
Artificial Intelligence and Machine Learning Services
- Sample Work
Artificial Intelligence and Machine Learning Services
-
- Meaningful Visualization Services
- Thought Leadership Services
- Report Generation Services
-
Report generation Service
- Sample Work
Report generation Services
-
- Data Analysis services
- Industries
- About Us
- Blog
- Insights
- Contact Us
Popular statistical data analysis tools and techniques used in market research
Meta Analysis Service
Recommended Reads
Contact us
Summary:
The current blog emphasizes the significance of applying statistics tools in business-to-business marketing research that consists of various tools such as regression, ANOVA, conjoint analysis, and factor analysis. Also, the current blog talks about the various software packages employed for this purpose, including R, Python, Tableau, Power BI, and SAS.
Numbers are everything when it comes to market research in B2B companies. Be it the setting of price points, the introduction of new products, or the channel selection process – all these decisions revolve around the data table, which relies on the quality of statistical data analysis tools used for market research. The current article will outline those statistical analysis techniques used in market research in B2B businesses, as well as the software that performs those operations [1].
Why Statistics Still Drives B2B Decision-Making
Statistical analysis of data consists of gathering, verifying, and analyzing numbers to solve a certain business issue — reasons for churning of enterprise customers, what factors determine renewals, and how price elasticity differs between sectors. As B2B data sets tend to be smaller and more segmented compared to consumer data, corporate market research requires much more careful approach in choosing the right methods than a mere survey analysis.
Core Statistical Techniques B2B Researchers Use
Linear Regression Analysis is still the workhorse in business market research when it comes to establishing causality. Linear regression analyzes the relationship between one independent variable (for example marketing budget) and the dependent variable (such as number of leads) [2], and Multiple regression analyzes the relationship of several independent variables to one dependent variable. This table shows the appropriate use for each method:
| Technique | What It Measures | Typical B2B Use Case |
| Regression analysis | Relationship between one dependent variable and one or more independent variables | Linking marketing spending, pricing, or service quality to lead volume or renewal rate |
| ANOVA test | Whether differences across three or more groups are statistically meaningful | Comparing response rates across multiple outreach campaigns |
| Conjoint / key driver analysis | Which product or service attributes actually influence a purchase decision | Pricing strategy, feature prioritization, packaging trade-offs |
| Factor analysis | Underlying patterns across many correlated variables | Condensing satisfaction scores, usage data, and support metrics into key themes |
| Multivariate analysis | Interactions among several variables at once | Customer segmentation across industry, size, and behavior |
| Descriptive statistics | Historical performance against a benchmark | Quarterly or annual account performance reviews |
| Dispersion analysis | How tightly data clusters around the average | Spotting outlier accounts before they skew a forecast |
A few quick takeaways worth keeping in mind when selecting a technique:
- Always begin with the business question rather than the tool. Questions about cause and effect require regression while those about group comparisons require ANOVA.
- When trying to understand what people will be willing to pay rather than what they say they value, use conjoint or key driver analysis.
- Leverage factor or multivariate analysis when there are more variables in a set of data than people can handle through manual inspection. This is also the basis of sound customer segmentation analysis [3].
- Do not overlook the importance of descriptive statistics and dispersion analysis. They highlight data problems before more sophisticated analyses exacerbate them.
Software That Powers B2B Statistical Analysis
Choosing between Tableau vs Power BI for market research usually comes down to workflow, and the same question applies across the rest of the analytics stack. Here’s a quick side-by-side view:
| Tool | Best For | Notes |
| Tableau | Fast, visual exploration of large datasets | Minimal setup; strong for dashboards and stakeholder presentations |
| Power BI | Teams already working inside Excel/Microsoft environments | Power Pivot and DAX bring Excel-style formula logic to advanced analytics |
| R and Python | Deeper statistical modeling and predictive work | Support regression, cluster analysis, and machine learning for forecasting customer behavior |
| SAS | Large-enterprise customer profiling | Strong for managing and optimizing marketing communications at scale |
Quick Tips for Selection: If creating a dashboard for leadership use is important, then Tableau or Power BI will always prevail; if creating predictive models or using R and Python in market research is your main task, then code-based solutions provide more flexibility; and if the company is already using SAS data analytics, then extending their investments makes more sense [4].
Market Research Statistical Consulting and When to Engage External Experts
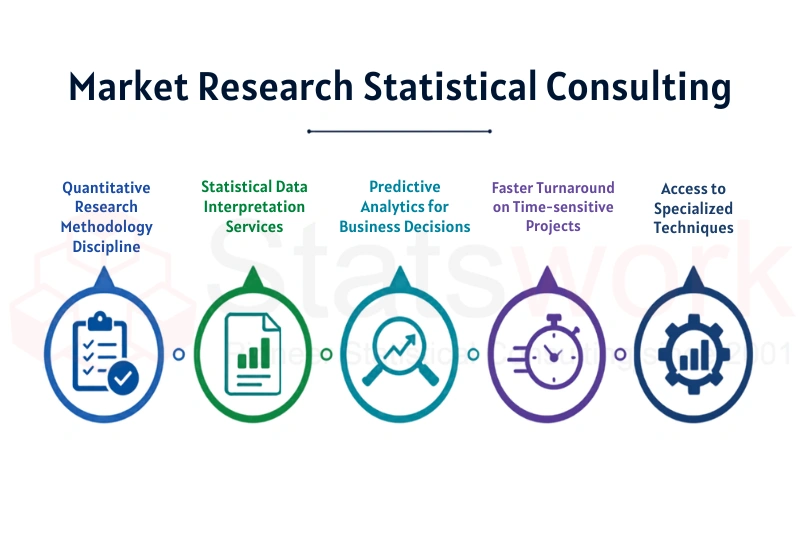
The most well-endowed companies still reach a point where their internal resources or analytical power run thin. This is precisely what market research statistical consulting is there to do: take raw data export and convert it to ready-to-use insights. There is an increasing trend for businesses to outsource their statistical analysis services, rather than to develop everything in-house, especially when talking about one-time tasks like conjoint analyses or massive segmentation. An external data analysis company will provide not only software licensing but also:
- Quantitative research methodology discipline — from sample design through final interpretation
- Statistical data interpretation services that translate output tables into plain-language recommendations executives can act on
- Predictive analytics for business decisions, helping teams move from “what happened” to “what’s likely to happen next”
- Faster turnaround on time-sensitive projects, without compromising analytical rigor [3]
- Access to specialized techniques (conjoint, multivariate, factor analysis) that may not exist in-house
Conclusion
Statistical tools only create value when matched to the right question and applied with methodological care — that’s what separates genuine insight from a spreadsheet full of numbers. Whether your team needs regression modeling, conjoint analysis, or a full segmentation study, getting it right the first time saves both budget and credibility.
Statswork has spent years helping corporate and B2B research teams turn complex datasets into clear, defensible findings through our dedicated Data Analysis service — covering everything from technique selection to final reporting.
Ready to make your next research project count? Talk to our statistical experts at Statswork today and turn your data into your next competitive advantage.
Frequently Asked Questions (FAQs)
Statistical techniques used in market research include descriptive statistics, regression analysis, correlation analysis, hypothesis testing, ANOVA, factor analysis, cluster analysis, conjoint analysis, and time series analysis, which help businesses understand customer behavior, identify market trends, and make informed decisions.
The seven basic Statistical Process Control (SPC) tools are the check sheet, histogram, Pareto chart, cause-and-effect (fishbone) diagram, scatter diagram, control chart, and flow chart, which are used to monitor, analyze, and improve process quality.
Market research and analysis use tools such as SPSS, R, Python, SAS, Microsoft Excel, Tableau, Power BI, Google Analytics, Qualtrics, SurveyMonkey, and Google Forms to collect, analyze, visualize, and interpret market data.
Statistical tools such as SPSS, R, SAS, STATA, Python, Minitab, and Microsoft Excel, along with techniques like descriptive statistics, regression, correlation, ANOVA, hypothesis testing, factor analysis, and cluster analysis, are widely used for effective data analysis.
The five common statistical tools used in research are SPSS, R, SAS, STATA, and Microsoft Excel, which help researchers manage data, perform statistical analyses, and present accurate research findings.
The seven types of statistical analysis are descriptive analysis, inferential analysis, predictive analysis, prescriptive analysis, exploratory data analysis (EDA), causal analysis, and mechanistic analysis, each serving a different purpose in understanding, interpreting, and predicting data.
References:
- Igharo, A. M., Olorunlana, A., & Okorie-Eugene, N. (2026). Selection of Appropriate Statistical Methods for Data Analysis: A Review. Matondang Journal, 5(1), 35-50.http://biarjournal.com/index.php
- Erickson, G. S. (2026). Marketing research to marketing analytics. Teaching Marketing Analytics, 1-24.https://www.elgaronline.com/
- Bodkhe, S. G. (2026). Machine Learning Optimization through Statistical Modelling. Scriptora International Journal of Research and Innovation (SIJRI), 9-16.https://scriptora.org/index.php/files
- AZELAMA, J., HARRIET, E. O., & OLATUNJI, T. S. (2026). CONTEMPORARY INNOVATIVE DIGITAL RESEARCH TOOLS AND SOCIAL SCIENCE RESEARCH. International Journal of Assessment and Evaluation in Education.https://mediterraneanpublic