
- Services
- Data Analysis services
- Sample Work
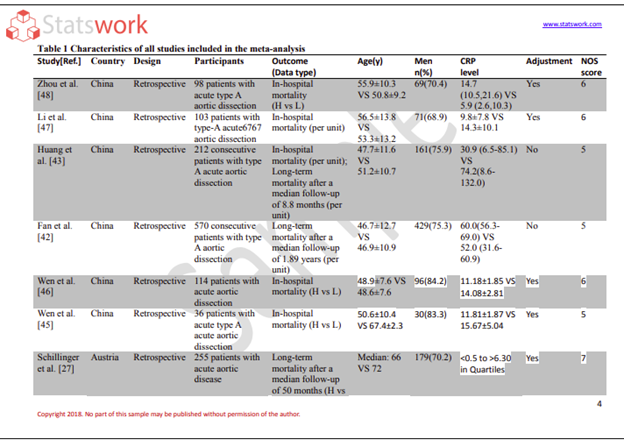
Data Analysis services
- Secondary Qualitative Research Services
- Secondary Quantitative Research Services
- Meta-Analysis Research services
- Sample Work

Meta-Analysis Research Services
- Data Collection Services
- Sample Work
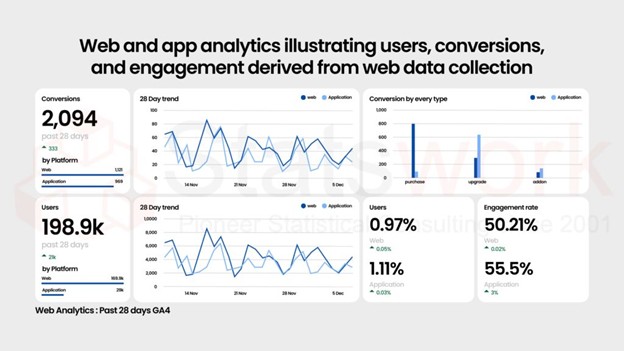
Data Collection Services
- Statistical & Biostatistics services
- Sample Work
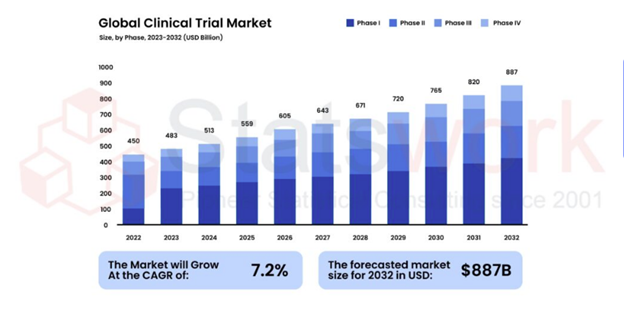
Statistical Programming & Biostatistics services
- Data Management Services
- Sample Work
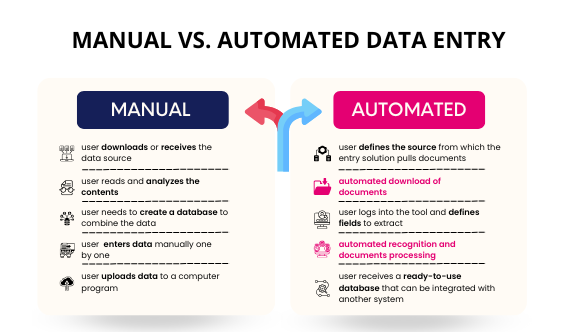
Data Management Services
- Research methodology services
- Sample Work
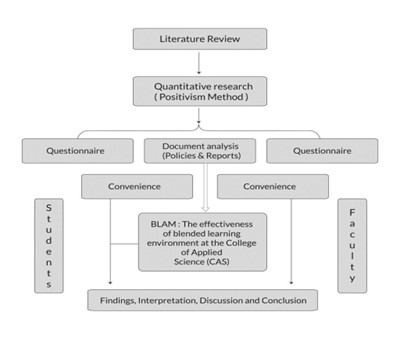
Research methodology services
- Tool Development Services
- Sample Work
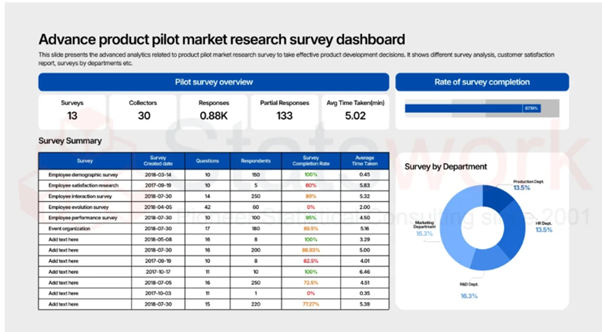
Tool development services
- Statistical Interpretation services
-
Statistical Interpretation services
- Sample Work
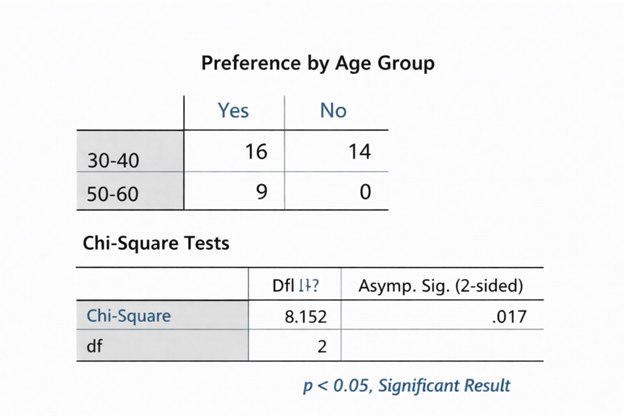
Statistical Interpretation services
-
- Sample Size Calculation Services
-
Sample Size Calculation Services
- Sample Work
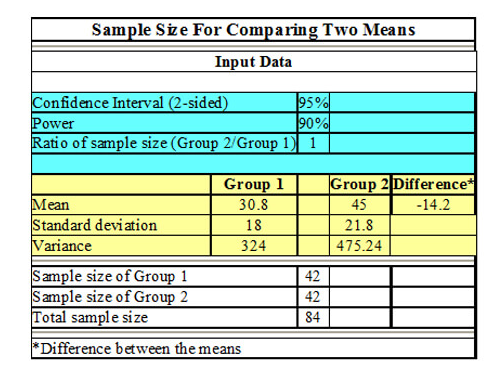
Sample Size Calculation Services
-
- AI & ML Services
-
Artificial Intelligence and Machine Learning Services
- Sample Work
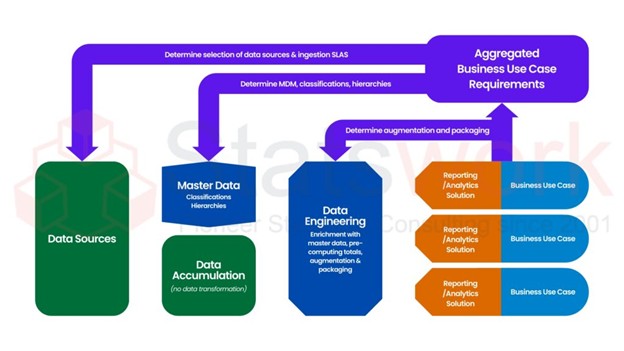
Artificial Intelligence and Machine Learning Services
-
- Meaningful Visualization Services
- Thought Leadership Services
- Report Generation Services
-
Report generation Service
- Sample Work
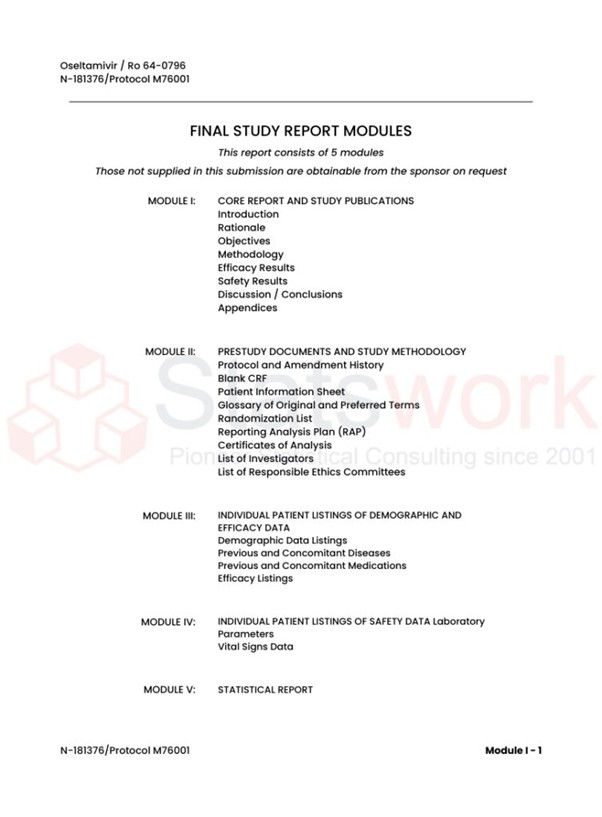
Report generation Services
-
- Data Analysis services
- Industries
- About Us
- Blog
- Insights
- Contact Us
- Services
- Data Analysis services
- Sample Work
Data Analysis services
- Secondary Qualitative Research Services
- Secondary Quantitative Research Services
- Meta-Analysis Research services
- Sample Work
Meta-Analysis Research Services
- Data Collection Services
- Sample Work
Data Collection Services
- Statistical & Biostatistics services
- Sample Work
Statistical Programming & Biostatistics services
- Data Management Services
- Sample Work
Data Management Services
- Research methodology services
- Sample Work
Research methodology services
- Tool Development Services
- Sample Work
Tool development services
- Statistical Interpretation services
-
Statistical Interpretation services
- Sample Work
Statistical Interpretation services
-
- Sample Size Calculation Services
-
Sample Size Calculation Services
- Sample Work
Sample Size Calculation Services
-
- AI & ML Services
-
Artificial Intelligence and Machine Learning Services
- Sample Work
Artificial Intelligence and Machine Learning Services
-
- Meaningful Visualization Services
- Thought Leadership Services
- Report Generation Services
-
Report generation Service
- Sample Work
Report generation Services
-
- Data Analysis services
- Industries
- About Us
- Blog
- Insights
- Contact Us
The theory of multilevel models and present applications of multilevel models as well as software for fitting such models
Meta Analysis Service
Recommended Reads
Contact us
Summary:
In this blog, multilevel models (aka, hierarchical linear models, HLM or mixed effect models) are described as a type of statistical analysis that can be performed on nested data or clustered data (e.g., students nested within schools, patients within hospitals). The topics covered include the basic theory behind multilevel modelling (fixed effects vs. random effects, assumptions), applications of multilevel modelling in academia and industry (education, health care, marketing, social sciences and longitudinal modelling), and some of the most popular software used to run such models (R, SPSS, STATA, SAS, HLM, MLwiN, GENSTAT). The article ends by suggesting how one should proceed with selecting an appropriate approach and software.
Introduction
However, modern research and corporate data are almost never collected in an unorganized and non-hierarchical fashion. Children are clustered into classes, classes into schools, and schools into districts; patients are clustered into clinics, employees into teams, and respondents into regions. Such clustering is referred to as hierarchical data or nested data, and analysis of such data using regular statistical methods may lead to biased results.
When observations within clusters are correlated, treating them as completely independent can lead to inappropriate standard errors and misleading statistical inference. Multilevel models account for this dependence by incorporating the hierarchical structure of the data [1].
In Brief
- There are residual terms in a multilevel model corresponding to the different levels in the hierarchy of the data structure, and not just an error term at the end.
- Multilevel modelling is a widely used approach to deal with clustered or grouped data.
- Models are very appropriate for data that involve repeated measures or are hierarchical in nature.
The data that is usually employed for the purposes of multilevel analysis originates from the data collection service [2], be it primary or secondary, and has a naturally hierarchical/clustered nature. Since businesses and scholars collect such data for a variety of different reasons and from various sources, they must employ an analysis tool which will allow them to establish connections between variables and reveal their importance. One of the possible tools of analysis is statistical analysis, which gives multiple ways to present the data — multilevel analysis being one of them.
What Is a Multilevel Model?
Multilevel models are statistical models designed for data in which observations are organized into nested or clustered structures, such as students within schools or patients within hospitals. They allow researchers to model variation within and between groups while accounting for the dependence among observations from the same cluster.
Core Assumptions
| Assumption | What It Means |
|---|---|
| Linearity | The relationship between predictors and the outcome is (at least approximately) linear at each level. |
| Normality | For linear multilevel models, residual distributions and random-effects distributions are commonly assessed for substantial departures from model assumptions. The appropriate assumptions depend on the outcome type and model specification |
| Homoscedasticity | Variance of residuals is roughly constant (homogeneity of variance). |
Note: Multilevel models extend regression frameworks to account for clustered or hierarchical observations. The relevant assumptions depend on the outcome type and model specification. For continuous-outcome models, researchers commonly assess the functional form of relationships, residual behaviour, and the distributional assumptions associated with the random effects and residuals. Generalized multilevel models use outcome-specific distributions and link functions rather than assuming normally distributed outcomes.
Intraclass Correlation Coefficient (ICC)
The intraclass correlation coefficient (ICC) measures the proportion of outcome variability attributable to differences between clusters. A higher ICC indicates greater similarity among observations within the same cluster and greater between-cluster variation relative to within-cluster variation. ICC can help researchers assess the extent of clustering and determine whether a multilevel modelling approach is appropriate for the research question and data structure.
Applications of Multilevel Models
Multilevel models are used wherever data is naturally grouped and a researcher wants to understand effects within groups and between groups at the same time.
Why Not Just Use Simple Linear Regression?
In simple linear regression, observations are generally treated as independent units. When observations are clustered—for example, students within schools or patients within hospitals—observations from the same cluster may be correlated. Ignoring this dependence can result in inappropriate standard errors and misleading statistical inference. Multilevel models explicitly represent the clustering structure and allow variation within and between groups to be modelled. [3].
Multilevel modelling solves this problem through accounting for the following aspects of data structure:
- Fixed effects: coefficients for predictors whose estimated associations are treated as common across the population or groups represented by the model. Predictors may be measured at different levels, and cross-level interactions can be included when the research question requires them.
- Random effects represent group-specific variation, such as differences in baseline outcomes across schools or differences in predictor effects across hospitals. A random intercept allows groups to have different baseline levels, while a random slope allows the effect of a predictor to vary across groups.
Whether to opt for fixed or random specification is a matter of the question and data available rather than a general principle.
Where Multilevel Modelling Is Used
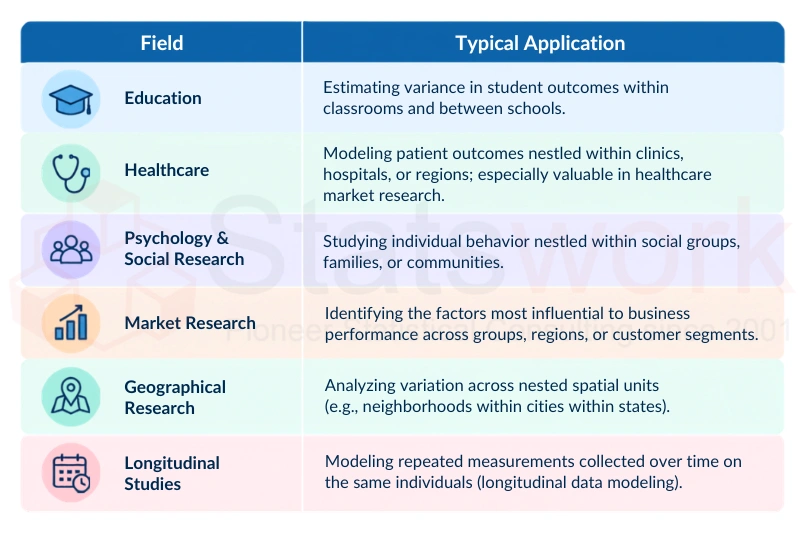
Key benefits of using multilevel models:
- Can account for clustering while estimating variation at both individual and group levels, when the hierarchical structure is relevant to the research question.
- Serve as a means of testing hypotheses regarding the variation of treatment effect within sub-groups.
- Multilevel models can provide more appropriate inference when observations are clustered and can simultaneously estimate individual-level and group-level variation. Their usefulness depends on the research design, cluster structure, sample size and model specification.
- Can accommodate multiple levels of grouping, such as employees within teams within organizations or patients within departments within hospitals
Known limitations to keep in mind:
- It may be challenging to generalize about the “average treatment effect” for all groups when effects do differ across groups.
- Treatment effects should be interpreted carefully, particularly in situations where there are random slopes.
- Inference is very much influenced by the number of groups and the way the groups were originally sampled.
Software for Fitting Multilevel Models
The next step after collection and cleaning of data is model fitting, and in most cases, it entails the use of specialized statistical software rather than just ordinary software. Multilevel and mixed-effects models can be fitted using several statistical packages, including R, SPSS, STATA and SAS, as well as specialist platforms such as HLM and MLwiN.
Common Software Packages for Multilevel Modelling
| Software | Comments |
|---|---|
| R (lme4, nlme, etc.) | flexible open-source environment with widely used packages for linear and generalized mixed-effects models. |
| SPSS | Famous for its easy-to-use graphical user interface and its MIXED procedure. |
| STATA | Good for panel/longitudinal analysis and multilevel/mixed effects models (mixed, melogit…). |
| SAS | Provides procedures such as PROC MIXED and PROC GLIMMIX for linear and generalized mixed-effects models. |
| HLM | A dedicated software environment designed specifically for hierarchical and multilevel models, with tools for specifying and interpreting multilevel analyses. |
| MLwiN | Specialized software for multilevel models; common in educational research. |
| GENSTAT | Commonly used in biological and agricultural research. |
How to choose: Software choice should be based on the outcome distribution, model structure, estimation requirements, diagnostic needs, available procedures or packages, reproducibility requirements, and the researcher’s familiarity with the platform. Different implementations can use different defaults or estimation procedures, so results should be checked against the model specification rather than assuming that different packages will produce identical estimates [3].
Another point to be aware of is that many of the software discussed were developed in academia and PhD dissertations, prior to becoming commercial or open-source software – hence, documentation varies. It is important to know the programming behind the software being used to interpret results effectively, rather than treat the model as a “black box.”
Conclusion
With the increase in size and diversity of research and business data, choosing the best method becomes increasingly important. Multilevel models present analysts with a way to analyse nested, clustered, and repeated measures data and account for the relationships within and between the groups that cannot be taken into consideration by simple regression models. Selecting the right model specification and appropriate software become essential parts of the process of obtaining valid and applicable results.
Because multilevel analysis depends on correctly structured hierarchical data, the data collection stage should preserve cluster identifiers, relevant group-level variables and repeated observations where applicable. Statswork supports structured data collection and statistical analysis workflows designed to prepare research datasets for appropriate downstream analysis.”
Need Support With Hierarchical or Multilevel Data?
Statswork can help with data collection, data preparation, statistical modelling, and interpretation for research and business datasets with clustered or repeated observations.
Book a Free Consultation to discuss your data structure and analysis requirements.
Frequently Asked Questions (FAQs)
A multilevel model can analyze students nested within schools. Students from the same school may have similar performance. The model considers both student-level and school-level factors.
Two common types are linear models and nonlinear models. Linear models assume a linear relationship between variables. Nonlinear models can represent more complex relationships.
Multilevel modelling is a statistical method for analyzing hierarchical data. It considers variables at different levels, such as patients within hospitals. It helps account for similarities among observations in the same group.
A multilevel Bayesian model combines multilevel modelling with Bayesian statistics. It estimates parameters using prior information and observed data. It is useful for analyzing data with multiple levels or groups.
Multilevel modelling can be challenging because it involves hierarchical data. Understanding regression, random effects, and model interpretation is important. With statistical software such as R, Stata, or SPSS, it becomes easier.
Linear regression estimates relationships using observed data and fixed statistical assumptions. Bayesian regression combines observed data with prior information. It produces probability distributions for the model parameters.
References:
- Banerjee, S., Gelfand, A. E., & Carlin, B. P. (2025). Hierarchical modeling and analysis for spatial data. CRC.https://books.google.co.in/book
- Dey, D., Haque, M. S., Islam, M. M., Aishi, U. I., Shammy, S. S., Mayen, M. S. A., … & Uddin, M. J. (2025). The proper application of logistic regression model in complex survey data: a systematic review. BMC Medical.https://link.springer.com
- Njaramba, F., & Olukuru, J. (2025). Surviving a crisis: A multilevel model of leadership styles, employees’ psychological capital and organizational resilience. https://journals.plos.org/plosone