
How Statistics assists in Consumer Packaged Goods data analytics
May 24, 2021
Role of Image Augmentation in improving the database for effective classification.
May 25, 2021R Studio In Data Analytics
Introduction:
R Studio is generally an IDE (Integrated Development Environment) for the statistical analytic platform R. It is an open-source language mainly implemented for statistical and mathematical analytics. R Studio possesses a console, highlight editor, importing the dataset, available in the structured format. R Studio and Python have highly required for Data Science projects and Data processing methods in this decade. Reputed organizations like Amazon Prime, Netflix and Hotstar access the R Studio to evolve their marketing strategies based on the recommendation systems. Hereby this blog will incorporate the need for R Studio in Data Analytics and its features. [1]
Need For R Studio:
While conducting the analysis process using R Studio, the dataset for the analytics is mandatory. R studio can import structured data such as Excel, Google sheets, CSV files, and SQL folders. The user interface of R Studio is efficient and reliable to access the dataset based on the requirement. Using the console part, the developer or analyst can run the code to evaluate the dataset. R Studio specifically designed for statistical and analytical purposes.Statistical analytics helps in selecting proper methods to collect the data, employ the correct analyses, and assist in effectively present the results. It developed with enormous analytical packages and library functions. Certain functions are efficiently run and produce the cumulative results better than other statistical languages.
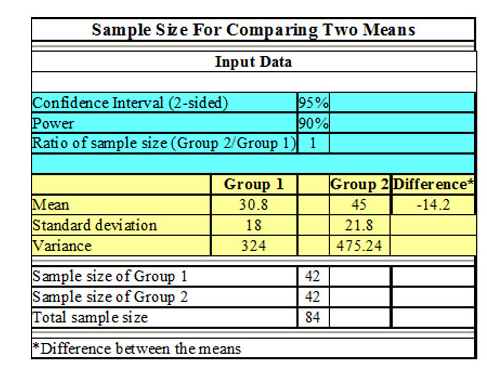
R studio supports the analyst to transform the data according to the convenience of the analyst. The transformation section may reduce the filthy columns and rows, which may not require other processes. There are many compressed techniques in the R Studio, such a describe() it can consolidately provide mean, median, mode, variance and standard deviation of the dataset. Likewise, many statistical techniques can reduce the tedious part of analytics done through analytical tools. [2]
Data Visualization:
For a better understanding of the data, pictorial and diagrammatic form is better and good looking. It is very tedious to understand the large volume of statistical data. Those data can be transformed into the visualized format for clear understanding.
Some specified techniques in R studio for data visualization are
- ggplot: stands for grammar of graphics. It provides a better graphical view of the dataset.
- qplot: Quick plot is used to plot the graph efficiently and in an understandable format.
- Scatterplot: Used to denote the cluster analysis
- Boxplot: Formal graphs with defined outliers.
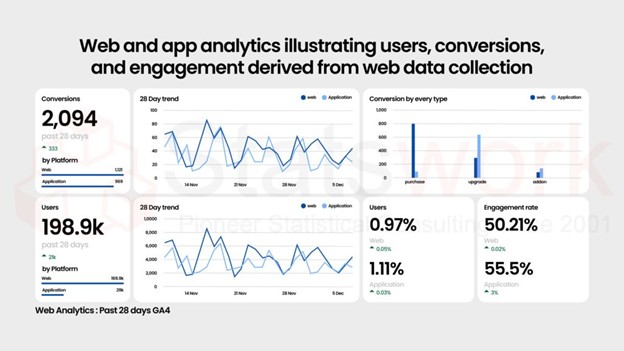
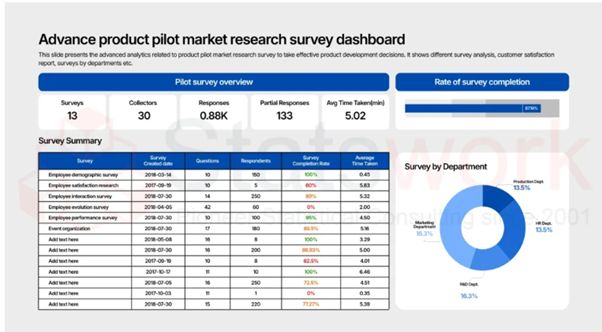
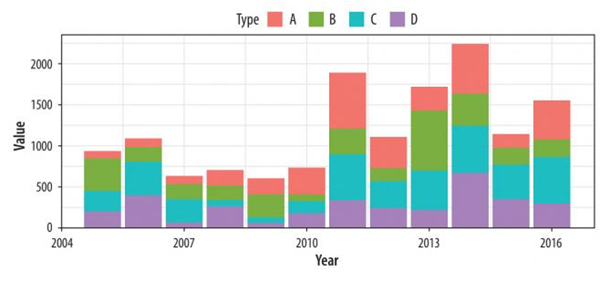
FIGURE 1 Transformation of data from dataset into graphical format.
Significance Techniques For Data Analytics Using R Studio:
| S.NO | TECHNIQUES | PURPOSE |
| 1 | view() | To view the required column from the data set. |
| 2 | head() & tail () | This technique will incorporate the first four and last four-column values |
| 3 | names() | To reveal and view the variable names of the dataset. |
| 4 | str() | To sort out and use the string function while performing analytics |
| 5 | summary() | The summary function is used to summarize the required values in the overall document. |
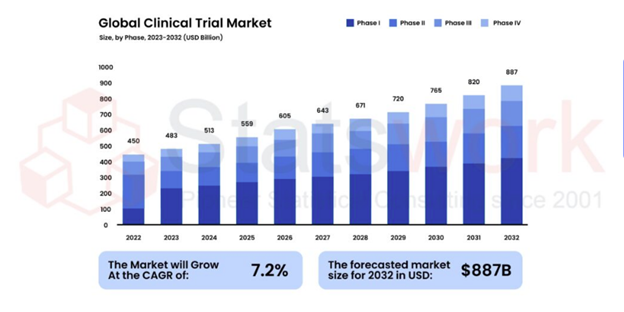
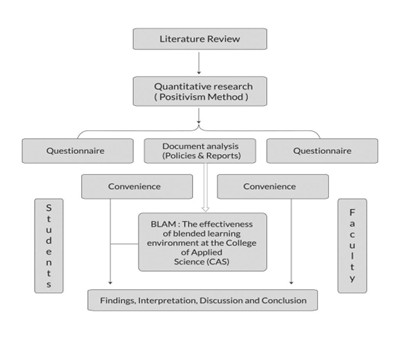
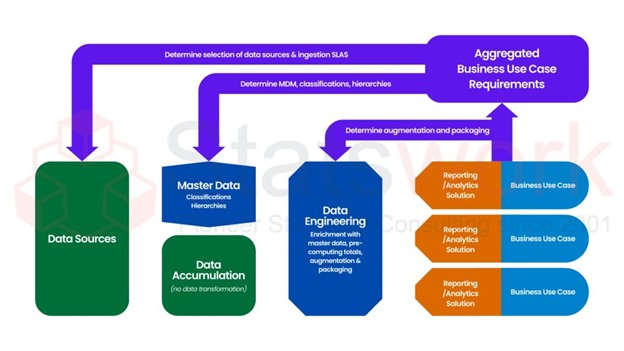
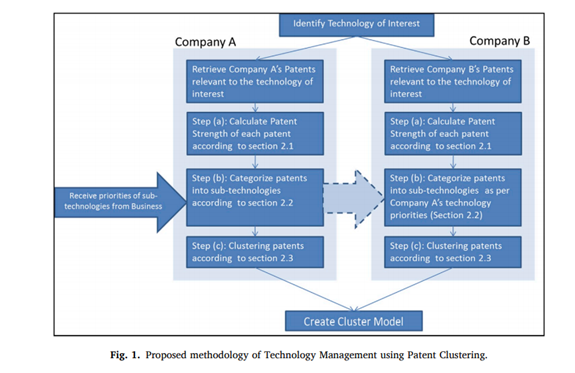
FIGURE 2Proposed methodology of technology management using patent clustering.
Conclusion:
The purpose of R Studio is to produce the cumulative results from the large amount of data. We can define it as Big Data analytics. As the data usage is primarily high, manipulating, handling and safeguarding those data for futuristic purposes is mandatory. There are many automation techniques in data analytics. Predictive analytics plays a vital role nowadays to forecast based on past data.
Future Scope:
1. In this decade developers and visualization processes are efficiently done using R Studio. Many upcoming researchers are undergoing to enhance the data analytics, statistics and mathematical functions. In many of the research, R Studio plays a vital role in visualization and analytical functions. [3]
2. As data ruling the world, to handle the large amount of data, specialists in data analytics are required. In future, all the processes can be recorded and logged as digital data. Data scientists are required to produce those data and estimate the results, and predict future enhancements. [4]
3. Especially, RStudio possesses more data analytical packages, and the coding size is not tedious to learn. Source code can be understood by people who possess enough knowledge in statistics and analytics. [5]
References:
1. Estrellado, Ryan A., et al. Data science in education using R. Routledge, 2020.
2. Jain, Ragini, et al. “Patent data analytics for technology benchmarking: R-based implementation.” World Patent Information 60 (2020): 101952.
3. Healy, Kieran. Data visualization: a practical introduction. Princeton University Press, 2018.
4. Irizarry, Rafael A. “The role of academia in data science education.” Harvard Data Science Review 2.1 (2020).
5. Rhys, Hefin I. Machine Learning with R, the tidyverse, and mlr. Manning Publications, 2020.
6. Sievert, Carson. Interactive web-based data visualization with R, plotly, and shiny. CRC Press, 2020.