
Significance of statistical software in data analysis: SPSS & STATA
March 25, 2021
Advanced Statistical Techniques and Tools for Water Quality Measurement
April 3, 2021Guidelines for Statistical Reporting on Clinical Trials Data
In-Brief:
- The statistical report writing gives an objective description of numerical data that are presented in a statistical table.
- The report writing on statistical data involves stating the trends or patterns seen in the table and indicating when the numbers do not necessarily fall within the general pattern or patterns.
Introduction
Statistical approaches are frequently used to analyze data and draw relevant conclusions. Inappropriate statistical approaches, on the other hand, may lead to unsuitable or incorrect conclusions. The statistical consistency of papers published in Indian medical journals includes statistical fallacies, and there have been few attempts to record this to date.
The use of statistics wrongly in clinical trials poses significant questions about the validity of the findings reported and their generalizability to the general population. Clinical trials are regarded as one of the highest levels of evidence regarding any intervention’s effectiveness. Therefore, the findings published in these trials aid in making effective clinical decisions.
The present manuscript attempts to insight into the inappropriate use of statistics during clinical trials and suggests possible methods by which such fallacies can be averted.
Misreporting Results of a Statistical Analysis
All statistical methods used in a trial should be published with a detailed explanation to allow readers to verify and recalculate the results as described by the authors. Popular statistical methods can be summarized in a few sentences, but some less common or obscure tests should be discussed in greater depth. For less popular or obscure statistical tests, a reference should be given.
If the particular statistical test is used more than once, it should be explicitly stated and defined concerning the endpoint and data used.
Many published clinical trials have nonspecific statements for explaining statistical tests. The “Chi-square test is employed for categorical data, or student t test is used for quantitative data” or “relevant statistical tests were used for Data analysis.”
Readers, especially those with non-statistical backgrounds, will be confused by such incorrect statements. As a consequence, detailed information about the situations in which a test is used should be given. Authors should also be cautious when describing test versions such as paired or unpaired.
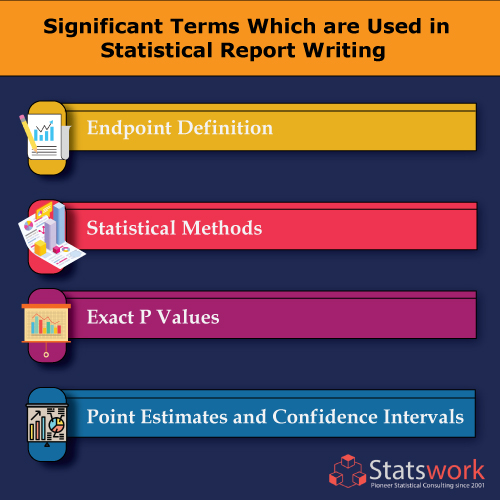
Significant terms which are used in statistical report writing
Endpoint definition
The term ‘endpoint’ represents the observed results for individual subjects and used as a measure of
outcome to calculate the statistical study results. It must be made clear which study
Endpoint signifies the outcome and which individual endpoint is used for evaluating the study endpoint. There are various ways in which individual-study endpoint sets and the most commonly used ones are shown in
- When approaches with more than one option, such as t-test (paired or unpaired), Analysis of variance, or rank correlation are used, specify which option was selected.
- The difference between a one-sided and two-sided test must be made.
- The two-sample t-test with paired data is considered as an alternative equivalent to a paired t-test. Similarly, the Wilcoxon test and the Mann-Whitney U test for unpaired data must be interchanged by the paired (signed) Wilcoxon test, and the McNemar test must interchange the simple χ2 test for 2 × 2 tables.
Statistical Methods
All statistical approaches used in a study must be essentially discovered with a reference. The following very general statistical methods can be encompassed without reference and appear only in the outcome section.
- t-test
- simple chi-square(d) (χ2) test
- Wilcoxon or Mann-Whitney U-test
- correlation and linear regression
All other statistical methods should be elaborated and referred to in the Methods section.
References for statistical methods and the study design must be standard works as far as possible, rather than original reports of designs or statistical methods.
Exact P Values
Exact P values, such as P =0.23, are preferable to the term ‘N.S.’ or ‘not significant. P values given in
tables or figures need not be repeated in the text. P values are preferably quoted to three decimal places, e.g. P= 0.025 or P= 0.003, but when P > 0.1, it is sufficient to keep to two decimal places, e.g. P= 0.25. Small P values can be expressed as P < 0.001 or P < 0.0001. Both ‘p‘ and ‘P‘ are allowed, although the international standard is P (large italic).
Point Estimates and Confidence Intervals
Showing confidence intervals is always preferable to reporting P values only. Mean differences in their
confidence intervals should preferably accompany continuous variables, proportions in categorical
variables and relative risks, including odds ratios and hazard ratios.
Statistical Significance and Clinical Importance
If a study sample is huge enough, even minor changes can become statistically significant. Hypothetically, a randomised clinical trial with more than 1500 enrolled patients can detect a 5% or smaller difference of 5-year surviving proportion. Also, minor differences may become statistically important if a study sample is large enough. A randomised clinical trial of more than 1500 patients could theoretically detect a 5% or smaller difference in the 5-year surviving proportion.
And if a difference is statistically important, it may or may not be clinically significant for particular patients. However, if a research sample is small, a large difference that does not achieve statistical significance cannot be overlooked if it is deemed clinically (possibly) meaningful. Authors should differentiate between “statistical significance” and “clinical relevance” and perform clinical trials to evaluate clinically significant outcomes.
Significant aspects that need to be considered while report writing on statistical data.
- Endpoints in clinical trials must be separated into primary and secondary endpoints.
- Sample size should be evaluated before proceeding with the clinical trial, and all elements of the Clinical sample size must be calculated and reported in the manuscript.
- Before employing any statistical test, all the assumptions for that statistical test must be achieved, and data regarding the same must be stated in the manuscript
- Standard demographic data of study groups must be compared to identify if any heterogeneity is there, but statistical tests must not be used. Any heterogeneity should be altered by adjusting the outcome through multivariate analysis.
- Appropriate statistical tests should be selected based on the study’s aim, type of data, and data distribution.
- Multiple endpoints should be adjusted by methods like Bonferroni, composite endpoint method etc.
- Post hoc subgroup analysis should be avoided.
- Missing data analysis should be done. In pragmatic clinical trials “Intent to Treat” principle should be utilised
- CONSORT statement should be followed during the reporting of clinical trials.
- Reference should be given for the less common or obscure statistical tests.
- Statistical tests should be mentioned in enough detail so the reader can replicate them.
- “Mean (S.D.)” should be used in the place of “Mean±SEM”
- Confidence interval should be given for the difference between the means for primary or important endpoints and should be given with or instead of P-value.
- Exact P values should be mentioned in the manuscript.
Conclusion
The most important problem in statistics is how to design a report, not how to present one’s findings or research. Re-analysis may save a well-designed study that was poorly analysed, but a poorly designed study is beyond redemption, even with sophisticated statistics. If you find difficulty in framing report you can reach out for statistical report writing service providers, to get a high quality content and report.
References
- Wilkinson, L. (1999). Statistical methods in psychology journals: Guidelines and explanations. American psychologist, 54(8), 594.
- Charan, J., & Saxena, D. (2012). Suggested statistical reporting guidelines for clinical trials data. Indian journal of psychological medicine, 34(1), 25-29.