

Benefits Of Big Data Analytics In Banking Industries
In-Brief:
- Data is essential for a business to carry out transactions and routine work. When the company or the organization is enormous, the volume of data to be utilized is large.
- Big Data technology is – software – utility that is prevalent and designed to analyze, extract, and process certain information or data related to functionalities.
- The data’s nature is voluminous, complex, and standard processing software may not be apt to carry out various analysis operations.
Introduction to the benefits of Big Data Analytics in the Banking Sector
Various actions can be performed on the data used in banks and even gain insights. It helps identify frauds quickly and effortlessly. The efficiency of processing financial transactions is enhanced and well-run. Customer interaction is easier, trading is useful, and mitigation of risk can be implemented with ease.
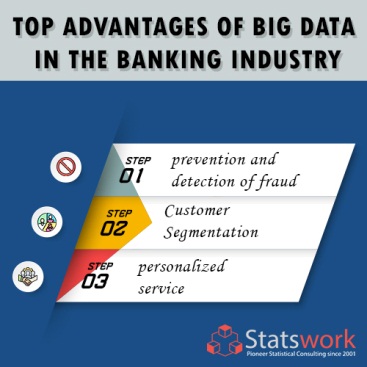
BENEFITS OF BIG DATA ANALYTICS IN BANKING INDUSTRIES
Big Data is well-organized with any concerns a banking customer may have related to privacy. With the help of customer profiles, personalized tactics related to marketing can be deployed for extensive data. Value can be projected on a long term basis with volumes of information. Customer segregation is more uncomplicated. It facilitates deep learning of customer spending behaviour to take decisions on loan and credit.
Data Analysis services and help is provided to business and organizations to collate all useful information related to research and transactions. Necessary data is collected, and various functions are performed to make the data useful. For instance, customer credit information would help a bank to process loans. Data analysis services for dissertation can be availed for minimal errors and accurate results. This service for a PHD dissertation is useful for statistical calculations. It is highly recommended because of the versatility to suit descriptive study/analysis and inferential researches.
SPSS is a tool that is widely used for data analysis. Complex calculations and functions can be performed. SPSS is the expanded form for Statistical Package for the Social Science. Online data analysis using SPSS is done by downloading the IBM SPSS Modeler 16.0. It cannot be used on phones, tablets, and i-PAD. It preferred to excel for its robustness. The pricing is 99 USD (basic plan – subscription) for a month and is auto-renewed. By opting for a suitable plan a license can be obtained to use the software. SPSS data analysis is suggested as it is user friendly and few clicks would help find mean standard deviations, and other operations.
SPSS data analysis using questionnaires is done by preparing a survey or set of questions. Survey monkey is widely used and data can be collected by sending the link to the respondents. Then the data is exported into the SPSS as individual rows. Summary information is not to be exported. Rename command is used to define and rename the variables. Working with each variable is assists in organized work.
Healthcare Data analysis using Python is prevalent as it predicts and analyses diseases. It can create alerts in the medical field as the developer can foretell a health condition’s severity. It can generate charts and organize data into a graph. Within few seconds treatment alternatives can be decided and a disease management plan can be formulated.
Survey Data analysis Services online is through various websites like survey monkey or outsourcing the work. These programs make the job of designing a survey or a questionnaire simple! While drafting a questionnaire online the pattern of answers expected and the results have to be kept in mind. This will help in collecting relevant information from the respondents. Online tools like survey monkey will show various proportions in pie charts, bar charts, and graphs. Outsource data analysis ensures that a company is competitive with its tactics or an in-depth study is outstanding. Productivity and quality of work are improved. The accountability is higher when tasks are outsourced and the quality is better. As the third party is engaged continuously in such specialized services, outsourcing would better handle the job.
Comprehensive Data Analysis services are an all-inclusive framework that uses important data and information for scrubbing, re-modelling it into various categories, and altering it to display findings. Data analysis outsourcing companies are recommended for the level of reliability, and for the professional approach maintained in keeping up with budget and timelines. Some of the best companies known are Wipro technologies, Infosys, CSC, and Accenture. Data analysis services for statistics are extended to process raw information. Most important functions include understanding the pattern and trends of past data, finding the mean or average, performing regression, planning on the sample size, formulating the hypothesis, standard deviation, and validating the hypothesis. Statistical consulting firms can formulate creative solutions and extend complete assistance for academic studies and other researches that companies may require. Best professionals and statisticians use the best techniques and tools and warrant the accuracy and reliable findings.
A statistical analysis plan is a document that contains all technical information that defines elaborately the steps and actions undertaken in relevance to the statistical investigation. To chart a good SAP the researchers or team can brainstorm ideas, formulate a flow chart, and catalogue the information into tables and graphs/figures for better clarity. All the variables are plotted, influencers and mediators are decided. With qualified statistical analysis help, an effective plan can be drafted. Various E-services, apps, and web services would be of assistance!! Online statistical analysis services are quick and have support with experience so that the analysis is not a cumbersome and confusing process. Excel, R, SPSS, and Stata is often used.
Exploratory data analysis for time series or EDA is imperative for various reasons. Before initiating the EDA is vital to formulate the problem statement to know the direction of the study. This would clarify the intention of the study. The problem statement would help to sync the EDA. Data could be CSV files, containing important data relevant to each category of the variable. Data frames are then analyzed!!! The observations are recorded for getting insights. Stationary time-series observations are used to compute autocorrelations which is further influential in choosing the model. In most cases, the time series may not be stationary!! Trends, differencing, de trends, re expressions and periodic symbols are a part of EDA. Data analysis for time series is vital to scrutinize the modifications/changes in the data figures over time. This helps in recording patterns and trends. This is done by the initial visualization process. The series is then made still; the optimal parameters are discovered. ARIMA models are designed and this helps to know insights and what to expect in future!! Data analysis using r employs a programming language for making computations and creating graphs of statistical nature. The program uses data mining and analysis!! Excel can be used to import the data into R. Any special symbols for instance $ or % is eliminated. The numerical format is followed. R is usually considered as difficult! The benefits of its flexibility and supremacy make it indispensable. The advantages are that it is an open-source language. It can be used for statistics, is independent of any platform, and facilitates quality graph generation and plotting of important information. It has become ideal as both structured and non-structured data. R is apt for the financial sector. All tasks and operations related to finance can be carried out and data extraction through the online approach can be applied!!
 Next Post