
- Services
- Data Analysis services
- Sample Work
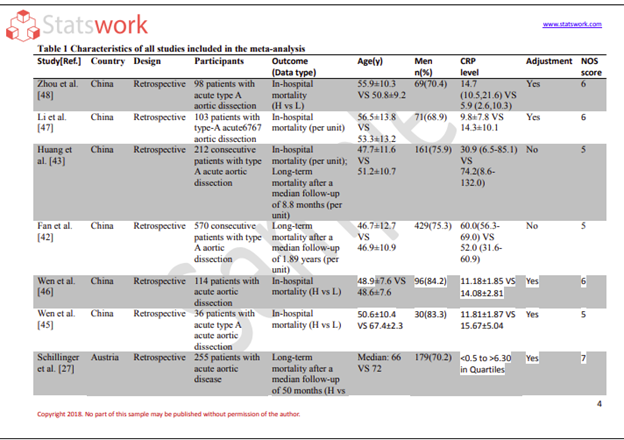
Data Analysis services
- Secondary Qualitative Research Services
- Secondary Quantitative Research Services
- Meta-Analysis Research services
- Sample Work
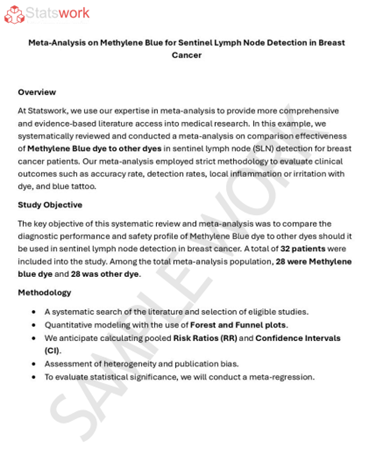
Meta-Analysis Research Services
- Data Collection Services
- Sample Work
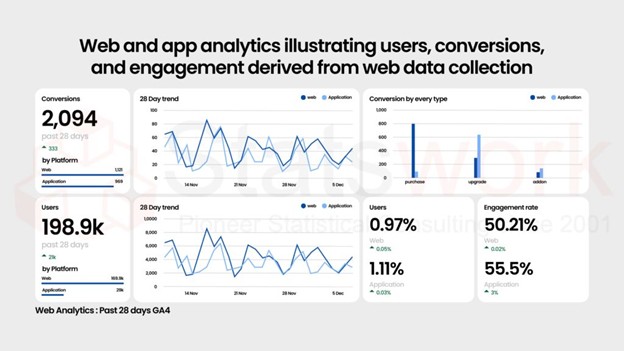
Data Collection Services
- Statistical & Biostatistics services
- Sample Work

Statistical Programming & Biostatistics services
- Data Management Services
- Sample Work
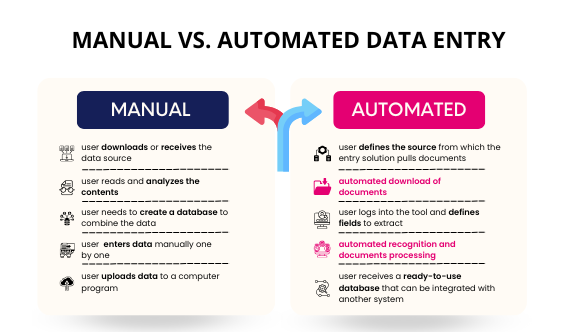
Data Management Services
- Research methodology services
- Sample Work
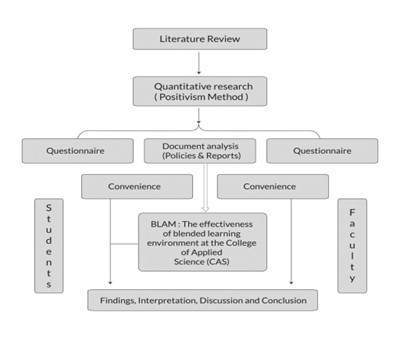
Research methodology services
- Tool Development Services
- Sample Work
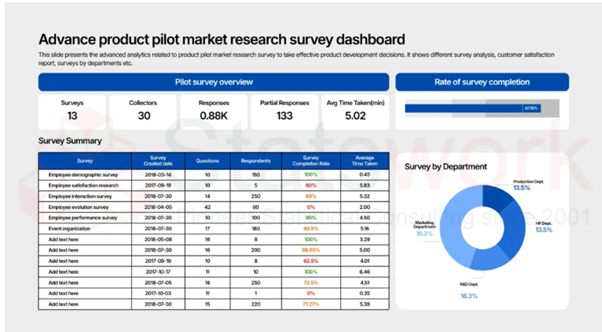
Tool development services
- Statistical Interpretation services
-
Statistical Interpretation services
- Sample Work
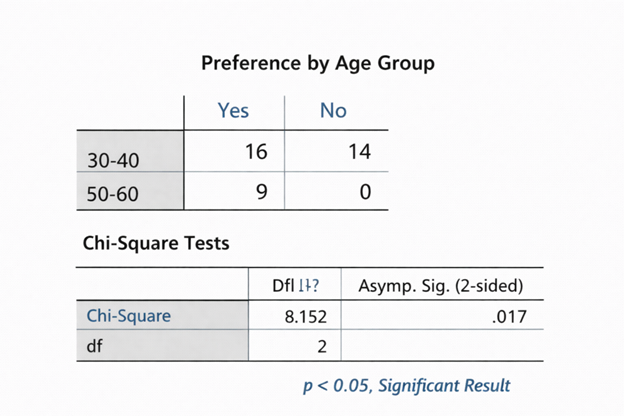
Statistical Interpretation services
-
- Sample Size Calculation Services
-
Sample Size Calculation Services
- Sample Work
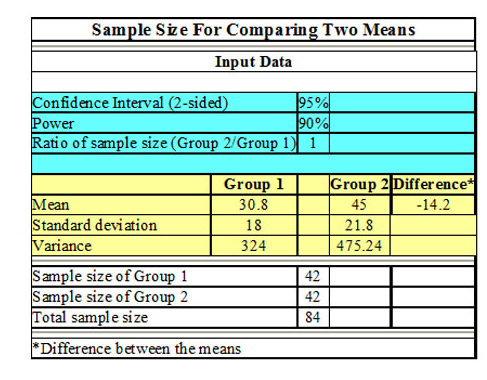
Sample Size Calculation Services
-
- AI & ML Services
-
Artificial Intelligence and Machine Learning Services
- Sample Work
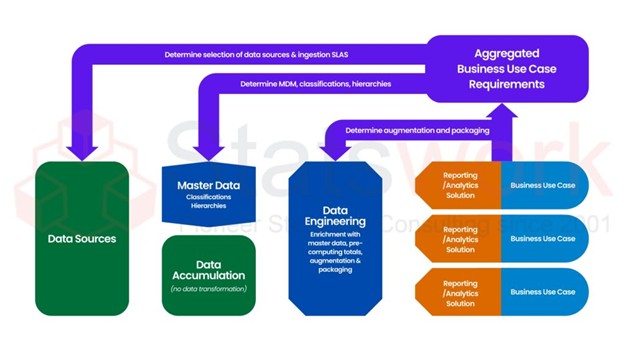
Artificial Intelligence and Machine Learning Services
-
- Meaningful Visualization Services
- Thought Leadership Services
- Report Generation Services
-
Report generation Service
- Sample Work
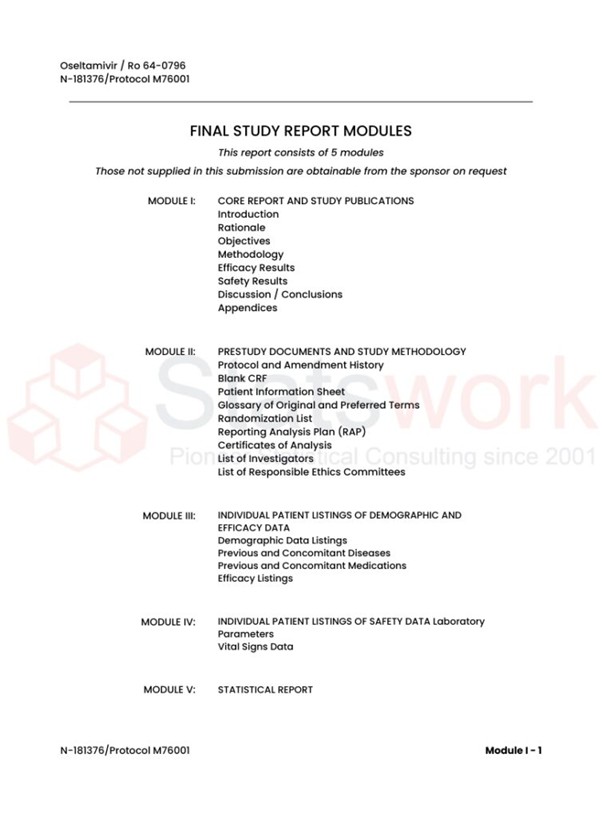
Report generation Services
-
- Data Analysis services
- Industries
- About Us
- Blog
- Insights
- Contact Us
- Services
- Data Analysis services
- Sample Work
Data Analysis services
- Secondary Qualitative Research Services
- Secondary Quantitative Research Services
- Meta-Analysis Research services
- Sample Work
Meta-Analysis Research Services
- Data Collection Services
- Sample Work
Data Collection Services
- Statistical & Biostatistics services
- Sample Work
Statistical Programming & Biostatistics services
- Data Management Services
- Sample Work
Data Management Services
- Research methodology services
- Sample Work
Research methodology services
- Tool Development Services
- Sample Work
Tool development services
- Statistical Interpretation services
-
Statistical Interpretation services
- Sample Work
Statistical Interpretation services
-
- Sample Size Calculation Services
-
Sample Size Calculation Services
- Sample Work
Sample Size Calculation Services
-
- AI & ML Services
-
Artificial Intelligence and Machine Learning Services
- Sample Work
Artificial Intelligence and Machine Learning Services
-
- Meaningful Visualization Services
- Thought Leadership Services
- Report Generation Services
-
Report generation Service
- Sample Work
Report generation Services
-
- Data Analysis services
- Industries
- About Us
- Blog
- Insights
- Contact Us
A Review on Basic Statistical Concepts of Sampling and Identifying Study Sample
Meta Analysis Service
Recommended Reads
Contact us
Summary:
Sampling is one of the major ideas in statistical research and analysis. No matter what area you are working on whether it is academic research, market research, or business research, you must understand sampling to obtain valid and reliable results from your research. This review covers some basic statistical ideas on sampling, along with guidelines to choose study samples.
The skill of choosing appropriate samples is particularly important for researchers, statisticians, and businessmen to make valid decisions based on data without studying whole populations [1].
1. Understanding Core Statistical Concepts
What is Sampling?
Sampling refers to the statistical technique whereby a portion of the subjects (sample) is drawn from a larger number of subjects (population) to help understand the whole. This process relies on the notion that what can be seen in a sample can be seen in the entire population.
Key Terminology in Sampling
| Concept | Definition | Example |
|---|---|---|
| Population (N) |
Complete set of all units of interest |
All 50,000 customers in database |
| Sample (n) | Subset selected for study |
500 randomly selected customers |
| Sampling Frame |
List from which sample is drawn |
Customer database with complete records |
| Sampling Unit | Individual element in population |
One customer account |
| Parameter | Characteristics of population |
Population mean (μ) |
| Statistic | Characteristics of sample |
Sample meaning (x̄) |
| Sampling Error |
Difference between sample & population values [2] |
Sample results ±3% from true value |
2. Basic Statistical Principles of Sampling
The Central Limit Theorem
The Central Limit Theorem forms an integral part of sampling theory; whenever samples are selected from any population, the distribution of the sample means becomes normally distributed.
Implications:
- Larger sample sizes produce more accurate estimates.
- Sample means cluster around the population means.
- Standard error decreases with larger samples (SE = σ/√n)
Standard Error and Confidence Intervals
Standard Error (SE) is a measure of the variability of statistics of samples around a population parameter.
Equation: SE = σ / √n
Where:
- σ = Population standard deviation
- n = Sample size
- √n = Square root of sample size
Important Note: Doubling the sample size leads to 50% reduction in standard error.
| Sample Size | Standard Error Change |
Implication |
|---|---|---|
| n = 100 | SE baseline | High variability |
| n = 400 | SE ÷ 2 | 50% improvement |
| n = 900 | SE ÷ 3 | 67% improvement |
| n = 2,500 | SE ÷ 5 | 80% improvement |
3. Types of Sampling Methods
A. Probability Sampling Methods
In Probability Sampling, every member of the population has the opportunity of being selected at known probabilities.
Simple Random Sampling
- Every member has an equal probability of being selected.
- Random numbers are generated.
- Appropriate for: Homogenous population
- Strength: Possibility of bias of any kind cannot be there
- Limitation: List of population is needed.
Stratified Sampling
- Population divided into homogeneous subgroups (strata)
- Random selection within each stratum
- Formula: n_h = (N_h / N) × n
- Best for: Diverse populations with distinct groups
- Advantage: Ensures representation of all subgroups
Systematic Sampling
- Selection at regular intervals (every kth element)
- Sampling interval: k = N / n
- Best for: Large databases
- Advantage: Quick, requires no randomization table
- Limitation: Risk of hidden pattern bias
Cluster Sampling
- Population organized into clusters
- Entire clusters randomly selected.
- Best for: Geographically dispersed populations
- Advantage: Reduces costs significantly
- Limitation: Highest sampling error among probability methods
B. Non-Probability Sampling Methods
Non-probability sampling relies on researcher judgment; used when population list unavailable or for exploratory research.
| Method | When to Use | Strength | Weakness |
|---|---|---|---|
| Convenience Sampling |
Preliminary testing |
Quick, economical |
High selection bias |
| Judgment Sampling |
Expert opinion needed |
Focused insights |
Subjective selection |
| Quota Sampling |
Population stratification |
Ensures quotas met |
Not statistically rigorous |
4. Identifying and Designing the Study Sample
Step-by-Step Sample Selection Process
Step 1: Define Population Characteristics
- Specify inclusion/exclusion criteria.
- Establish population boundaries.
- Document eligibility requirements.
- Example: “Active B2B clients with annual spending >$50,000”
Step 2: Calculate Required Sample Size
Formula (Finite Population): n = (Z² × p × q × N) / [(e² × (N-1)) + (Z² × p × q)]
Formula (Infinite Population): n = (Z² × p × q) / e²
Where:
- Z = Z-score for confidence level (1.96 for 95%)
- p = Expected proportion (0.5 if unknown)
- q = 1 – p
- e = Margin of error (0.03-0.05)
- N = Population size
Step 3: Sampling Technique Selection
- Match technique to structure of target population
- Consider budget/time restraints
- Think about data quality needs
- Account for expected non-responses
Step 4: Conducting Sampling Procedure
- Document all procedures
- Keep sampling frame intact
- Account for non-responses
- Verify representative sample

The following ranges are general planning guidelines; the appropriate sample size should be determined based on the study design, statistical power, expected variability, confidence level, and desired precision .
5. Quality Control in Sampling
How to Reduce Sampling Errors
- Sample Size: One of the most effective techniques (squared relationship)
- Stratification: Helps in ensuring representativeness
- Randomization: Eliminates any form of bias
- Respondent Rate: Should be at least 70% for an effective sample.
- Non-response Bias: Conduct non-response analysis.
- Check Sample Representativeness: Compare with the population statistics.
Testing for Sample Representativeness
List of Questions to Ask:
- Sample statistics match population.
- Respondent rate recorded
- Non-response bias analyzed.
- Selection bias assessed [3]
- Sampling process described
- Confidence intervals calculated
- Limitations stated
6. Common Applications Across Sectors
- Academic Research → Stratified Sampling of students
- Market Research → Systematic sampling of customer database
- Clinical Research → Cluster random sampling of hospitals or regions
- Quality control → Systematic sampling of batches
- Employee Research → Stratified sampling of departments or locations
Ready to optimize your research sampling strategy? Our statistical consulting team has helped 500+ corporate and academic clients design robust studies with optimal sampling strategies. Get started with your free research assessment today.
[Schedule Free 30-Min Consultation]
Conclusion
It is vital for the research process that a researcher possesses knowledge about the principles of sampling. Knowledge about the operation of various sampling methods, knowledge about correct sample size and application of quality control methods will make research valid.
Key takeaways:
- Sample size calculation is mathematical and precise.
- Sampling method selection depends on population structure.
- Random selection minimizes bias.
- Documentation is critical for validity.
- Verification ensures representativeness.
Whether conducting academic research or organizational studies, proper sampling methodology is the foundation of credible, actionable insights.
Need expert guidance on sampling design or sample size calculations? Our statswork consulting team specializes in designing robust research studies with optimal sampling strategies for academic and corporate clients.
Frequently Asked Questions (FAQs)
The seven types are simple random, stratified, systematic, cluster, convenience, judgment, and quota sampling.
The blog does not specify five sample statistics; it only defines a statistic as a characteristic calculated from a sample, such as the sample mean (x̄).
Statistical sampling is the process of selecting a portion of a population to study and using the sample results to understand the larger population.
The blog specifies four steps: define the population, calculate the required sample size, select the sampling technique, and conduct the sampling procedure.
The four probability sampling methods are simple random sampling, stratified sampling, systematic sampling, and cluster sampling.
Sample size can be calculated using n = (Z² × p × q × N) / [(e² × (N−1)) + (Z² × p × q)] for a finite population, or n = (Z² × p × q) / e² for an infinite population.
References:
- Mukti, B. H. (2025). Methods in health research: Probability and non-probability sampling. Health Sciences International Journal, 3(2), 220-234. https://hsij.anandafound.com/
- Zrineh, A., Al‐Usta, M., & Alwawi, A. (2026). Sampling methods and sample size determination in clinical research: an educational review.Journal of general and family medicine, 27(1), e70096. https://onlinelibrary.wiley.com/doi
- Mukti, B. H. (2025). Sample size determination: Principles and applications for health research. Health Sciences International Journal, 3(1), 127-143. https://hsij.anandafound.com