
- Services
- Data Analysis services
- Sample Work
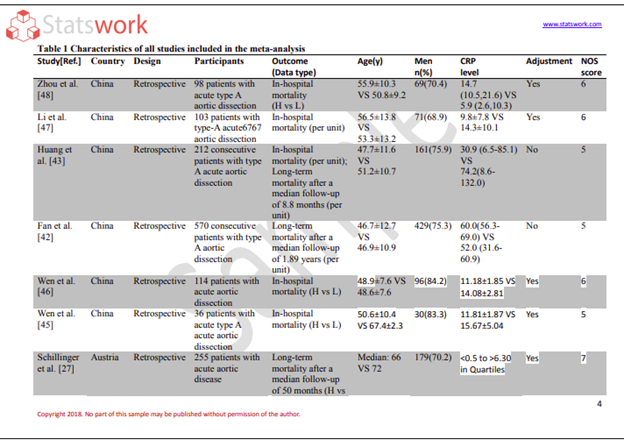
Data Analysis services
- Secondary Qualitative Research Services
- Secondary Quantitative Research Services
- Meta-Analysis Research services
- Sample Work

Meta-Analysis Research Services
- Data Collection Services
- Sample Work
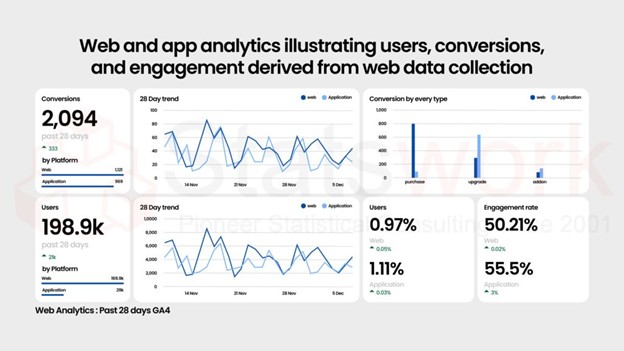
Data Collection Services
- Statistical & Biostatistics services
- Sample Work
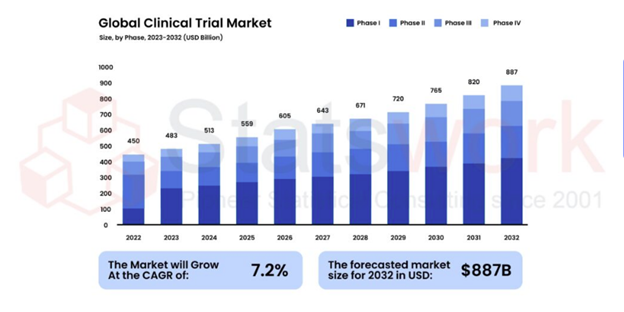
Statistical Programming & Biostatistics services
- Data Management Services
- Sample Work
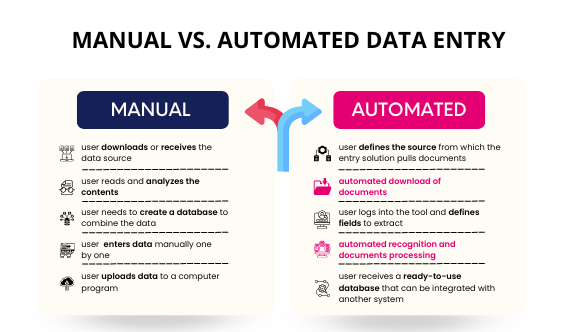
Data Management Services
- Research methodology services
- Sample Work
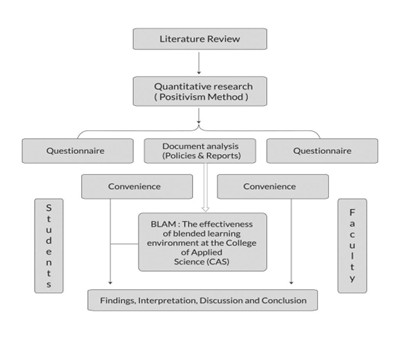
Research methodology services
- Tool Development Services
- Sample Work
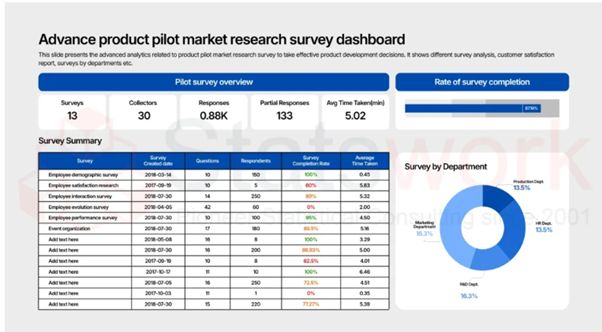
Tool development services
- Statistical Interpretation services
-
Statistical Interpretation services
- Sample Work
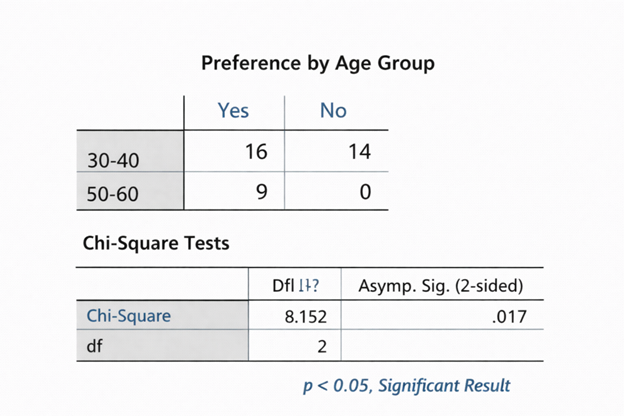
Statistical Interpretation services
-
- Sample Size Calculation Services
-
Sample Size Calculation Services
- Sample Work
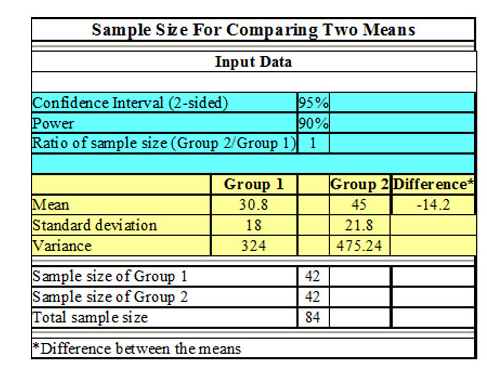
Sample Size Calculation Services
-
- AI & ML Services
-
Artificial Intelligence and Machine Learning Services
- Sample Work
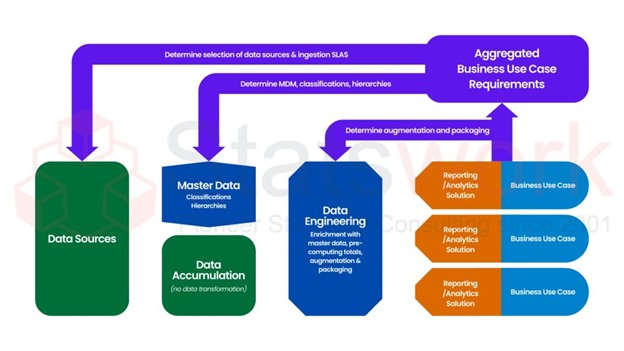
Artificial Intelligence and Machine Learning Services
-
- Meaningful Visualization Services
- Thought Leadership Services
- Report Generation Services
-
Report generation Service
- Sample Work
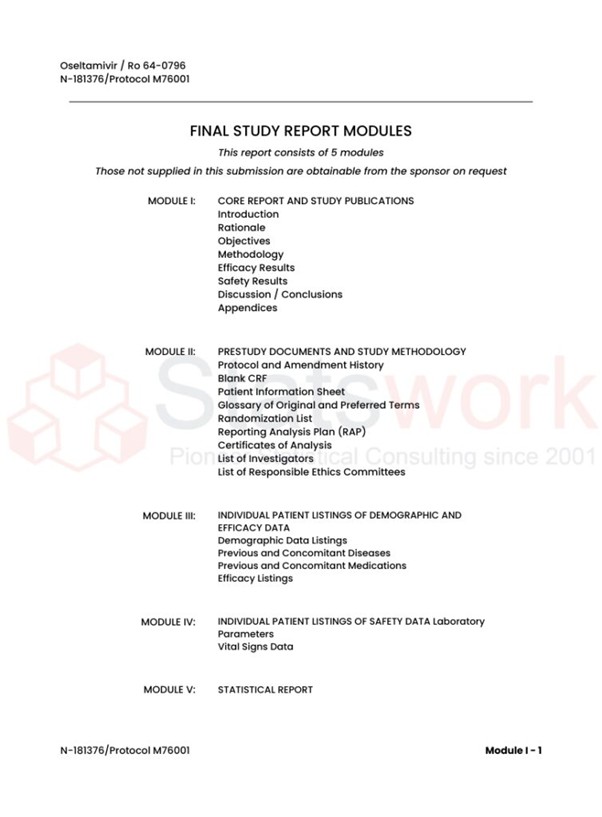
Report generation Services
-
- Data Analysis services
- Industries
- About Us
- Blog
- Insights
- Contact Us
- Services
- Data Analysis services
- Sample Work
Data Analysis services
- Secondary Qualitative Research Services
- Secondary Quantitative Research Services
- Meta-Analysis Research services
- Sample Work
Meta-Analysis Research Services
- Data Collection Services
- Sample Work
Data Collection Services
- Statistical & Biostatistics services
- Sample Work
Statistical Programming & Biostatistics services
- Data Management Services
- Sample Work
Data Management Services
- Research methodology services
- Sample Work
Research methodology services
- Tool Development Services
- Sample Work
Tool development services
- Statistical Interpretation services
-
Statistical Interpretation services
- Sample Work
Statistical Interpretation services
-
- Sample Size Calculation Services
-
Sample Size Calculation Services
- Sample Work
Sample Size Calculation Services
-
- AI & ML Services
-
Artificial Intelligence and Machine Learning Services
- Sample Work
Artificial Intelligence and Machine Learning Services
-
- Meaningful Visualization Services
- Thought Leadership Services
- Report Generation Services
-
Report generation Service
- Sample Work
Report generation Services
-
- Data Analysis services
- Industries
- About Us
- Blog
- Insights
- Contact Us
Multivariate Model Building: Rules, Steps & Real Examples
Qualitative Research Service
- What Is Multivariate Model Building?
- How to Build a Multivariate Model: 5 Core Rules
- Multivariate Regression Model Example: Predicting Car Price
- Interpreting the Regression Coefficients
- Why This Matters for Corporate Data Teams
- Beyond Linear Regression: How Advanced Industries Use Multivariate Modeling
- Conclusion
News & Trends
Recommended Reads
Contact us
Summary:
The process of multivariate modeling allows businesses to analyze the effects of several variables together to reach data-based decisions. In this article, you will learn about the basics of multivariate regression, five fundamental rules in creating multivariate models, an example on predicting car prices using multivariate analysis, and its applications in advanced industries.
There is no business decision made purely based on a single independent variable. For instance, revenues are based on pricing, season, cost of marketing, and competition concurrently. Similarly, customer attrition is based on patterns of usage, customer service engagement, and billing records at the same time. In the presence of such multiple influences, univariate regression analysis becomes inadequate, hence multivariate modeling comes in handy [1].
This article demystifies what multivariate model building involves, the five principles ensuring statistical integrity in multivariate model building, and an actual case of a regression problem.
What Is Multivariate Model Building?
Multivariate modeling involves the statistical method whereby a particular phenomenon, such as the price of an item or its risk score, is predicted based on the combined effect of multiple independent variables. This is as opposed to analyzing one variable at a time when it comes to making predictions of the dependent variable.
The concept is important for organizations as it helps in predicting real-world business outcomes by considering multiple variables at once. It eliminates blind spots in decision making while helping in measuring the risk even before it occurs [2].
How to Build a Multivariate Model: 5 Core Rules
There is no single formula that works for every dataset, but these five rules form the foundation of reliable multivariate model building, whether you’re running the analysis in-house or working with statistical model building services.
Rule 1: Understand What is Being Measured by All Predictors
Rule 2: Conduct Exploratory Analysis Before Everything Else
Rule 3: Examine Relationships Using Correlation and Bivariate Methods
Rule 4: Pick an Appropriate Modeling Approach
Rule 5: Interpret Regression Outputs with Discipline
Rule 1: Understand What is Being Measured by All Predictors
- The regression coefficient represents the effect of all the predictors, considering all other predictors.
- Do not assume the effect of the coefficient represents the total effect of the predictor on its own.
- Ensure all the predictors are unique in contributing using R² and F-statistics [3].
Rule 2: Conduct Exploratory Analysis Before Everything Else
- Conduct exploratory analysis such as analyzing summary statistics and missing values before constructing a regression model.
- Test for the predictors whether there are outliers, skewness, and multicollinearity issues.
- Histograms, scatter plot, and residual plot are used to conduct data analysis.
Rule 3: Examine Relationships Using Correlation and Bivariate Methods
- Conduct correlation analysis to measure relationships among variables prior to regression.
- Conduct cross tabulation or other forms of bivariate analysis to examine relationships for individual variables.
- Cross checks these findings with those obtained from the final regression model to explain changes in the significance of predictors.
Rule 4: Pick an Appropriate Modeling Approach
- Consider the research question and the number of predictor variables in choosing the appropriate regression approach.
- In case there are many predictor variables, analyze various combinations of them rather than all [4].
- Stepwise regression is one such method that helps in selecting the predictors.
Rule 5: Interpret Regression Outputs with Discipline
- Note how the regression coefficients and adjusted R² change with addition or omission of certain variables.
- Evaluate the predictors by analyzing their p values (usually ≤ 0.05) and t values.
- Maintain the main-effect variable in the model even though its interaction term is significant.
Multivariate Regression Model Example: Predicting Car Price
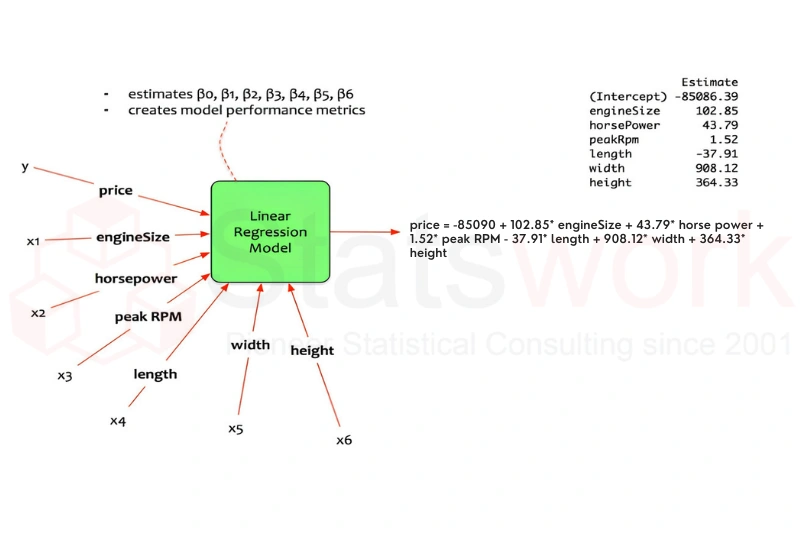
To see these rules in action, consider a practical multivariate regression model for example: predicting car price using engine size, horsepower, peak RPM, length, width, and height as predictor variables.
General model structure:
y = β0 + β1×1 + β2×2 + … + βnxn
Applied to this case:
Price = β0 + β1(Engine Size) + β2(Horsepower) + β3(Peak RPM) + β4(Length) + β5(Width) + β6(Height)
Running this through statistical software produces a fitted equation like:
Price = −85,090 + 102.85(Engine Size) + 43.79(Horsepower) + 1.52(Peak RPM) − 37.91(Length) + 908.12(Width) + 364.33(Height)
Interpreting the Regression Coefficients
- Length: Holding all other predictors constant, each one-unit increase in length is associated with a $37.91 decrease in average price.
- Horsepower: Holding all other predictors constant, each one-unit increase in horsepower is associated with a $43.79 increase in average price.
Each remaining coefficient can be read the same way — isolating the effect of one variable while assuming the others stay fixed [4].
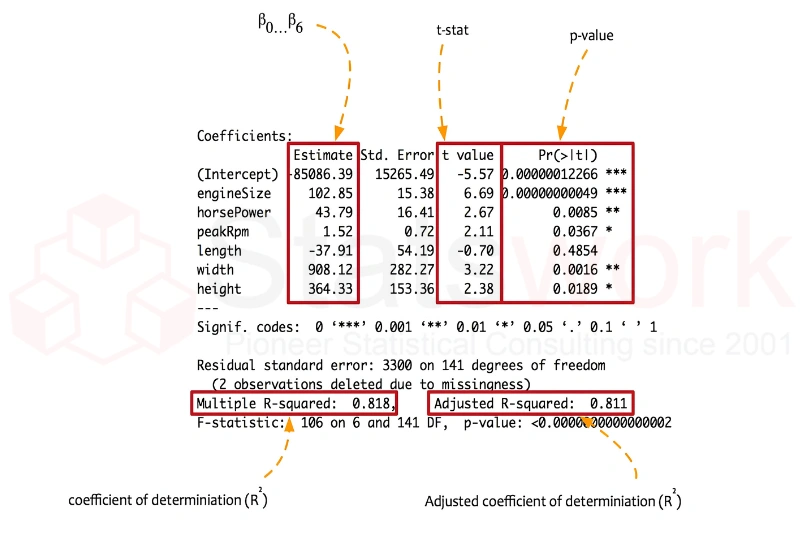
Evaluating the Model: t-value, p-value, and Adjusted R²
Model evaluation is where statistical interpretation earns its value. The t-value indicates whether a predictor has a meaningful relationship with the outcome; in this example, length’s negative coefficient signals it isn’t adding the expected positive impact on price. The p-value determines significance against the standard 0.05 cutoff. Finally, the adjusted R² for this model comes out to roughly 0.81 — meaning the model explains about 81% of the variation in car price, a strong indicator of overall fit.
Why This Matters for Corporate Data Teams
For business teams, the payoff of disciplined multivariate model building isn’t the equation itself — it’s the confidence to act on it. A well-built model gives finance teams sharper forecasts, gives operations teams early warning on risk, and gives leadership a defensible, data-backed rationale for strategic calls. Getting there consistently, across changing datasets and business questions, is where many internal teams benefit from bringing in specialized support.
Beyond Linear Regression: How Advanced Industries Use Multivariate Modeling
- The use of multivariate modeling goes beyond regression in businesses and can be found in various industries to perform the analysis of complex databases.
- Analytical chemistry includes PLS (Partial Least Squares) regression that reduces multi-correlated variables and provides accurate prediction using high dimensional data set. Other types of models such as non-linear or deep learning can be employed in more complicated situations [3].
- Structural and seismic engineering considers various variables including seismic intensity, the direction of earthquakes and characteristics of buildings when analyzing the dangers and damages from earthquakes.
- In any industry, multivariate modeling needs to understand predictors and the choice of proper techniques.
Conclusion
Multivariate model building turns scattered business data into a single, interpretable equation that predicts outcomes with measurable confidence. From understanding predictor effects and running exploratory data analysis, to choosing the right model-building strategy and interpreting adjusted R², p-values, and t-values correctly — each rule protects the model from misleading conclusions.
If your organization needs support building or validating a multivariate model, Statswork offers dedicated Multivariate Regression Analysis Services, Statistical Data Analysis Services, and Statistical Interpretation Services to help corporate data teams turn complex, multi-variable data into decisions they can trust. Get in touch with Statswork to discuss your dataset and modeling goals.
Frequently asked question:
A multivariate model is a statistical technique that examines the combined effect of two or more independent variables on a single dependent variable, enabling more accurate predictions and better decision-making.
A multivariate regression model is built by performing exploratory data analysis, selecting relevant predictor variables, checking assumptions such as multicollinearity, fitting the regression model, and interpreting the results using regression coefficients, p-values, and adjusted R².
ANOVA compares the means of one dependent variable across different groups, whereas MANOVA compares the means of two or more dependent variables simultaneously to evaluate the overall effect of independent variables.
A structured approach involves defining the research objective, conducting exploratory data analysis, testing relationships among variables, selecting the appropriate regression technique, validating the model, and interpreting the results carefully.
Common multivariate modelling techniques include multiple linear regression, logistic regression, MANOVA, principal component analysis (PCA), factor analysis, partial least squares (PLS) regression, and structural equation modelling (SEM).
Popular software for multivariate analysis includes R, Python, SPSS, SAS, Stata, MATLAB, and Minitab, with the best choice depending on the complexity of the analysis, dataset size, and user expertise.
Reference
- Olivieri, A. C. (2026). Old advice on multivariate calibration: still in force but not always followed. A tutorial. Analytica Chimica Acta, 345155. https://www.sciencedirect.com/science/article/abs/pii/S0003267026001054
- Li, S. Q. (2026). Seismic fragility assessment model for regional building structures considering multivariate intensity measures. Archives of Civil and Mechanical Engineering, 26(2), 44. https://link.springer.com/article/10.1007/s43452-025-01402-4
- Guo, X., Dang, Y., Shen, X., Cai, Z., Ding, S., & Huang, S. (2026). Spatiotemporal information fusion for urban-agglomeration carbon-emission forecasting: a grey multivariate model with composite city proximity. Grey Systems: Theory and Application, 1-25. https://www.emerald.com/gs/article-abstract/16/2/272/1334557/Spatiotemporal-information-fusion-for-urban?redirectedFrom=fulltext
- Bekele Dessie, D., Shuke Kitawa, Y., & Gashaw Asfaw, Z. (2026). Gender inequality in asset ownership in Ethiopia: a multivariate spatial analysis. Cogent Social Sciences, 12(1), 2622116. https://www.tandfonline.com/doi/abs/10.1080/23311886.2026.2622116