
- Services
- Data Analysis services
- Sample Work
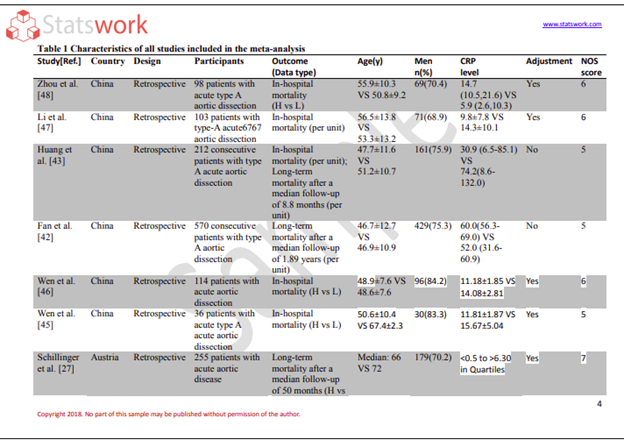
Data Analysis services
- Secondary Qualitative Research Services
- Secondary Quantitative Research Services
- Meta-Analysis Research services
- Sample Work
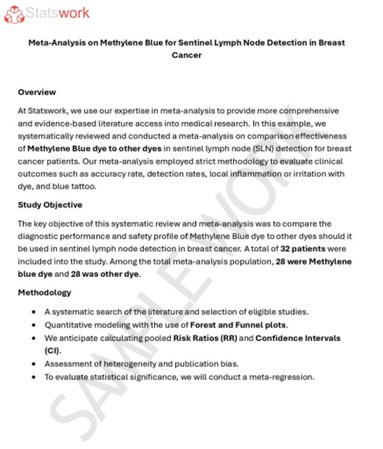
Meta-Analysis Research Services
- Data Collection Services
- Sample Work
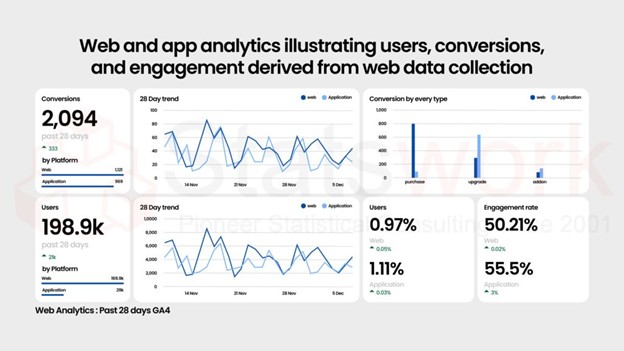
Data Collection Services
- Statistical & Biostatistics services
- Sample Work

Statistical Programming & Biostatistics services
- Data Management Services
- Sample Work
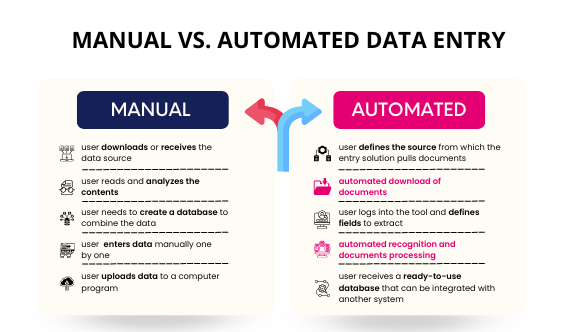
Data Management Services
- Research methodology services
- Sample Work
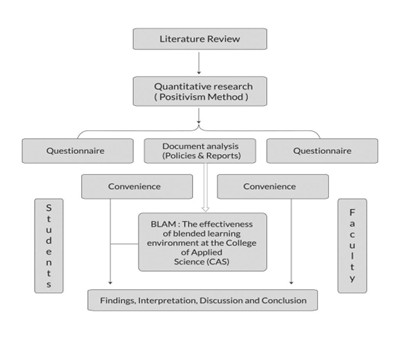
Research methodology services
- Tool Development Services
- Sample Work
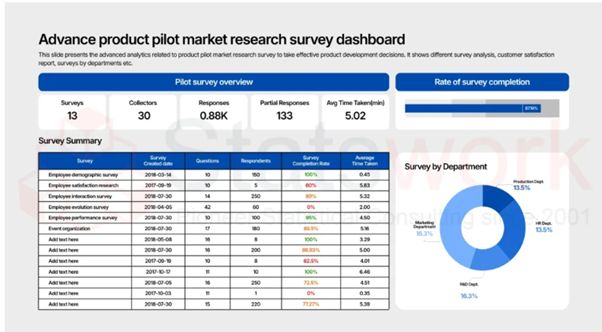
Tool development services
- Statistical Interpretation services
-
Statistical Interpretation services
- Sample Work
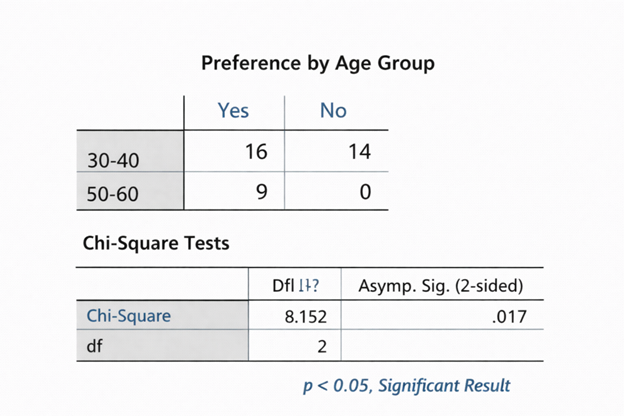
Statistical Interpretation services
-
- Sample Size Calculation Services
-
Sample Size Calculation Services
- Sample Work
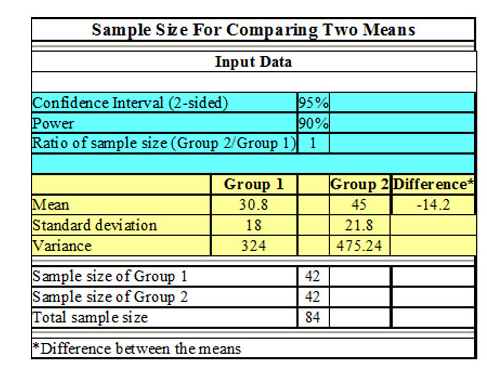
Sample Size Calculation Services
-
- AI & ML Services
-
Artificial Intelligence and Machine Learning Services
- Sample Work
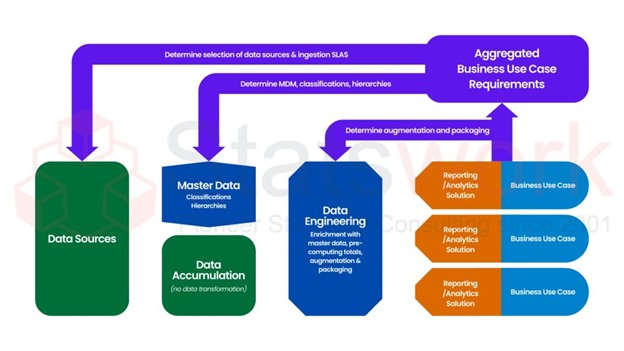
Artificial Intelligence and Machine Learning Services
-
- Meaningful Visualization Services
- Thought Leadership Services
- Report Generation Services
-
Report generation Service
- Sample Work
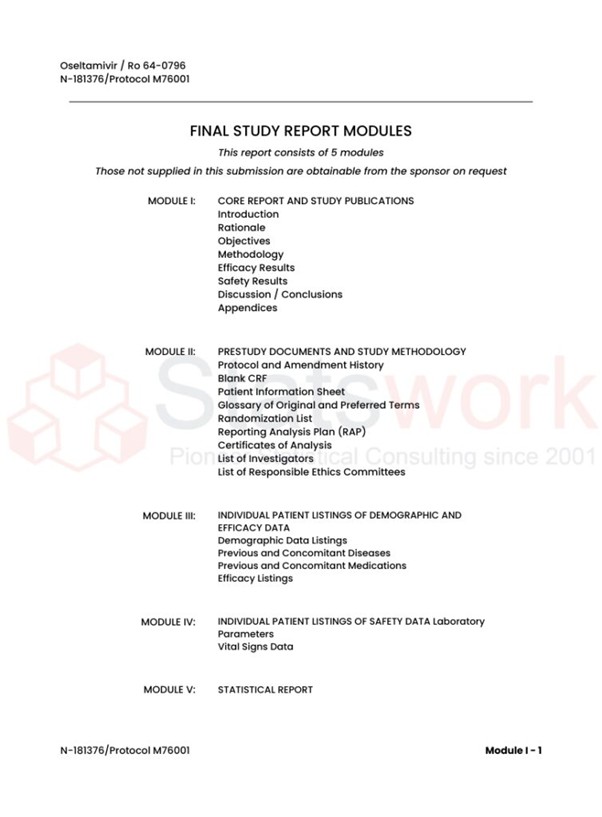
Report generation Services
-
- Data Analysis services
- Industries
- About Us
- Blog
- Insights
- Contact Us
- Services
- Data Analysis services
- Sample Work
Data Analysis services
- Secondary Qualitative Research Services
- Secondary Quantitative Research Services
- Meta-Analysis Research services
- Sample Work
Meta-Analysis Research Services
- Data Collection Services
- Sample Work
Data Collection Services
- Statistical & Biostatistics services
- Sample Work
Statistical Programming & Biostatistics services
- Data Management Services
- Sample Work
Data Management Services
- Research methodology services
- Sample Work
Research methodology services
- Tool Development Services
- Sample Work
Tool development services
- Statistical Interpretation services
-
Statistical Interpretation services
- Sample Work
Statistical Interpretation services
-
- Sample Size Calculation Services
-
Sample Size Calculation Services
- Sample Work
Sample Size Calculation Services
-
- AI & ML Services
-
Artificial Intelligence and Machine Learning Services
- Sample Work
Artificial Intelligence and Machine Learning Services
-
- Meaningful Visualization Services
- Thought Leadership Services
- Report Generation Services
-
Report generation Service
- Sample Work
Report generation Services
-
- Data Analysis services
- Industries
- About Us
- Blog
- Insights
- Contact Us
The Importance of Choosing the Right Data Collection Method for Business Research
Qualitative Research Service
News & Trends
Recommended Reads
Contact us
Summary:
Writing a good introduction for your statistics coursework sets the tone by highlighting the research background, purpose, and reliability of the work. Using an effective process in writing the introduction along with proper research objectives will help enhance the level of your coursework. Statswork can help universities, researchers, and corporates write excellent statistics coursework without plagiarism.
How to Write a Winning Introduction to Your Statistics Coursework
Writing an effective introduction is one of the most important stages of statistics coursework, as it establishes the research context, objectives, and credibility of the study, cursor flashing before you, unable to think of a way to begin writing your statistics coursework? Well, you are not alone. This is where you either make it or lose it, and you can only get one shot at convincing your tutor that your work is worth a second look.
Statistics coursework is not just a mere process, it could affect your grade, your research reputation, and even be linked to your dissertation. Let’s see how to do this effectively.

Why Your Introduction Deserves Extra Attention
Introduction is usually the criterion used to assess the quality of the coursework by the professors within the first few paragraphs. A good introduction:
- Demonstrates that you are knowledgeable about the subject
- Gives you an instant credibility
- Establishes the expectations from the work
- Saves the time of your reader
- Make your statistics coursework example unique
It can be compared to a trailer to the movie – no one will sit to watch the film if the trailer is boring [1].
The Ideal Structure briefly
A well-built introduction typically runs 2–3 pages and includes these core building blocks:
| Functions of Introduction Section | Description | Lines |
| Attention and Background | Captures the reader’s attention and provides background information on the research topic. | 1–2 paragraphs |
| Literature Review | Summarizes relevant literature and highlights existing gaps or limitations. | 1 paragraph |
| Research Question | Clearly states the research problem or question being addressed. | 2–3 sentences |
| Research Objectives and Hypotheses | Outlines the research objectives and the expected outcomes or hypotheses. | 1 paragraph |
| Thesis Statement | Presents the central argument or thesis of the research. | 1–2 sentences |
| Conclusion Hook | Ends the introduction with a statement that encourages readers to continue. | 1–2 sentences |

Step 1: Plan Before Typing One Word
Skipping the planning process is the quickest way to create an unstructured paper. Prior to writing your first line:
- Collect all the research material and have it ready to use
- Create an outline of how your argument will flow
- Analyze which statistical concepts will be mentioned (regression analysis, hypothesis testing, sampling, etc.)
- Make a list of sources to cite
A well-developed concept, poorly executed, almost never earns good grades, while the opposite scenario usually succeeds [2].
Step 2: Create a Hook That Will Hook Your Audience
Start with something that will demonstrate the relevance of the chosen topic in the real world. What is its current importance? Find a connection to a trend, a problem, or a statistic that will get people interested in the topic.
Conclude this part with a brief overview of your research question and the reason you chose it. Use clear language and avoid any technical terms until the methodology section.
Step 3: Identify Your Goals and Formulate a Good Thesis
This is where you can demonstrate the usefulness of your statistics project introduction. Make sure you do the following:
- Identify the aim of your project in 1-2 clear sentences
- Specify what possible results may be expected from your research
- Provide examples of practical application of your statistics research findings
- Formulate a good thesis statement
A vague aim results in vague coursework.
Step 4: Provide Some Final Thoughts in Conclusion of Your Introduction
Do not simply end your introduction with a summary. Try to ask a provoking question or make some predictions which will attract your audience to the next part of your paper [3].
Quick Checklist Before You Move On
- Do I have an eye-catching opening line?
- Have I specified my research question clearly?
- Is my thesis statement clear and testable?
- Have I mentioned related previous research work?
- Does my final line arouse curiosity?
Concluding Remarks
An effective introduction to statistics coursework is not one that merely uses big, complicated language. It is about being clear, relevant, and confident.
In Conclusion: Reason Behind the Trust in Statswork by B2B Teams and Companies
Universities, research divisions, and support teams in charge of coursework can care less about quality if they lack the consistency of their work. The ability to write one great introduction is easy – to maintain it on the consistent level is not.
The Statistics Coursework of Statswork is a service aimed at working with companies, research departments, and other businesses that need:
- Certified statisticians who know how to apply the same standards of quality as in an academic institution
- The introduction of the coursework written to your specifications and free of plagiarism
- The scalable service for the bulk and regular coursework requirements
- The quick delivery of the work with no compromise made to its accuracy and correctness
- The point of contact for our enterprise-level customers
Ready to see the difference expert statistical support makes? Get in touch with Statswork today and discover how our statistics Coursework service can become a trusted extension of your team.
Frequently asked question:
To prepare for an introduction to statistics, review basic mathematical concepts, understand key statistical terms, and familiarize yourself with data collection, data analysis, and probability fundamentals.
A strong introduction for a statistics project should present the research topic, explain its importance, state the research objectives, and provide a brief overview of the methodology and expected outcomes.
An introduction to statistics is the study of methods used to collect, organize, analyze, interpret, and present data for informed decision-making and research.
Statistics can be introduced to students by using real-life examples, simple datasets, visual charts, and practical activities that demonstrate how data is used to solve everyday problems.
An introduction to statistics is not difficult when concepts are learned step by step with practical examples, consistent practice, and a clear understanding of fundamental statistical principles.
Sir Ronald A. Fisher is widely regarded as the father of modern statistics because of his pioneering contributions to statistical theory, experimental design, and data analysis.
Reference
- Dumais, S. A., Spence, N. J., & Dierker, L. (2026). A Comparison of First-and Continuing-Generation Students Completing a Project-Based Introductory Statistics Course. Numeracy, 19(1), 7. https://digitalcommons.usf.edu/
- Kennedy-Shaffer, L. (2025). An Undergraduate Course on the Statistical Principles of Research Study Design. The American Statistician, 79(4), 520-528. https://www.tandfonline.com/doi/abs
- Out, L. (2025). Fostering Quantitative Reasoning in Introductory Psychology through Asynchronous Assignments Featuring Low-Stakes Quizzes, Data Analysis, and Visualization Activities: Fostering Quantitative Reasoning in Introductory Psychology through Asynchronous Assignments Featuring Low-Stakes Quizzes, Data Analysis, and Visualization Activities Fostering Quantitative Reasoning in Introductory Psychology through Asynchronous Assignments Featuring Low-Stakes Quizzes, Data Analysis, and Visualization Activities …. https://cuny.manifoldapp.org/read