


What is defined as Grafana?
- Home
- Insights
- Article
- What is defined as Grafana?
Qualitative Research Service
News & Trends
Recommended Reads
Data Collection
As the data collection methods have extreme influence over the validity of the research outcomes, it is considered as the crucial aspect of the studies
- 1. Introduction
- 2. DeepHealth’s Diagnostic Suite™: Revolutionizing Radiology Workflows
- 3. Key Features
- 4. AI Impact on National Screening Programs
- 5. SmartMammo™: Enhancing Breast Cancer Screening
- 6. DeepHealth AI Use Cases Across Specialties
- 7. Strategic Collaborations and Ecosystem Expansion
- 8. Impact and Adoption of DeepHealth’s AI Solutions
- 9. Conclusion: The Future of Radiology with AI
- 10. References
In today’s world, organization’s function based on continuous insights provided by their systems and applications. Solutions that help in the translation of raw data into valuable insights are essential in this regard. Grafana has become one of the most widely used solutions that enable real-time analysis and help in understanding trends and making decisions based on valuable insights.[1]
Understanding the Core Purpose of Grafana
Grafana is intended to assist users in understanding complex data by displaying it in a format that is easy to view. Grafana serves as a link between data and human comprehension.
- It can connect to various data sources to fetch time-series and operational data.
- It facilitates Data Monitoring by monitoring the status of systems continuously.
- It allows teams to view past data trends along with real-time data.
- It makes decision-making easier by using simple graphs and charts.
Grafana primarily aims to make data interpretation easy and accessible.
How Visual Dashboards Enhance Insight
At the core of Grafana is its powerful graphical interface, which allows users to interactively explore their data. The graphical interface makes a huge difference in understanding complex data points.
- Dashboard Visualization enables users to see multiple data points on a single interface.
- Interactive panels assist users in drilling down to specific data points.
- Visual indicators such as thresholds and color-coding enable users to quickly identify anomalies.
- Data Visualization makes it easier for users to understand data by using charts and graphs instead of tables.
The combination of flexibility and interactivity in Grafana dashboards makes monitoring a proactive process.[3]
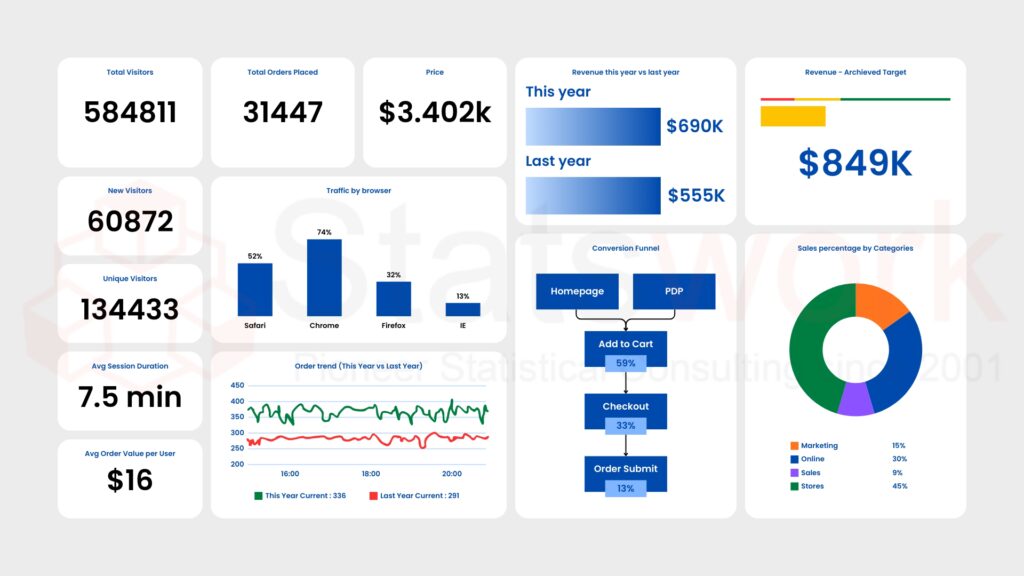
Fig 1 shows a Grafana dashboard visualizing real-time system metrics and performance insights.
Key Functional Areas of Grafana
Functional Area | Description | Practical Benefit |
Data Integration | To connect to different databases and monitor items. | To have central access to metrics. |
Visualization Tools | To provide visualizations of graphs, heat maps, and gauges. | To display trends clearly. |
Alerting System | To notify if specific conditions are met. | To respond to issues quickly. |
Customization | To support plugins for custom layouts. | To create custom user experiences. |
This overview summarizes how Grafana incorporates functionality while providing a usable interface for these different operational needs.[4]
Use Cases Across Industries
The flexibility of Grafana makes it a versatile tool that can be applied across many fields, ranging from IT to business analytics. The flexibility of Grafana enables one to customize it depending on the desired objective.
- The IT department utilizes Grafana to analyse server, network, and application performance.
- Companies analyse KPIs and business operations in near real-time.
- Scientists use Grafana to display experimental or sensor data for pattern recognition.
- Cloud infrastructure uses Grafana for scalable Data Monitoring solutions.
The above examples illustrate how Grafana can be used to serve both technical and non-technical audiences.[5]
Hence, Grafana is not just a monitoring solution; it is an all-in-one visualization and analytics platform that helps in converting data into actionable insights. With the help of interactive dashboards, flexible integrations, and real-time alerting, Grafana enables users to effectively comprehend complex systems. By incorporating effective Dashboard Visualization and Data Visualization, Grafana is an integral part of today’s data-driven world.
Bring your metrics to life with Grafana-powered Data Visualization from StatsWork—monitor smarter, see clearer, and act faster.
Reference
- Chakraborty, M., & Kundan, A. P. (2021). Grafana. In Monitoring cloud-native applications: Lead agile operations confidently using open source software(pp. 187-240). Berkeley, CA: Apress. https://link.springer.com/chapter/10.1007/978-1-4842-6888-9_6
- Leppänen, T. (2021). Data visualization and monitoring with Grafana and Prometheus. https://www.theseus.fi/handle/10024/512860
- Yong, G. K. (2019). A data analytic module to extend grafana functionality. Phd Diss. UTAR. http://eprints.utar.edu.my/3490/1/CS-2019-1503490.pdf
- Chan, N. (2019). A resource utilization analytics platform using grafana and telegraf for the Savio supercluster. In Practice and Experience in Advanced Research Computing 2019: Rise of the Machines (learning)(pp. 1-6). https://dl.acm.org/doi/abs/10.1145/3332186.3333053