
- Services
- Data Analysis services
- Sample Work
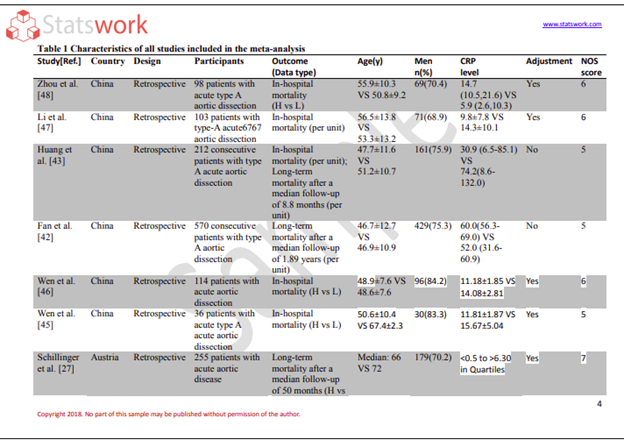
Data Analysis services
- Secondary Qualitative Research Services
- Secondary Quantitative Research Services
- Meta-Analysis Research services
- Sample Work
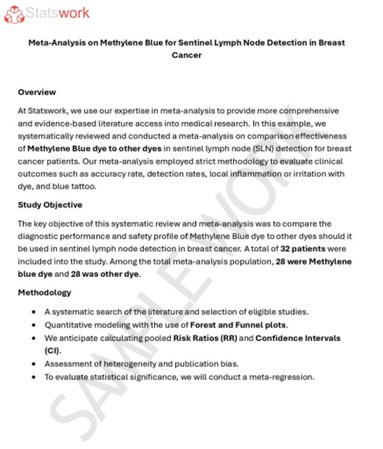
Meta-Analysis Research Services
- Data Collection Services
- Sample Work
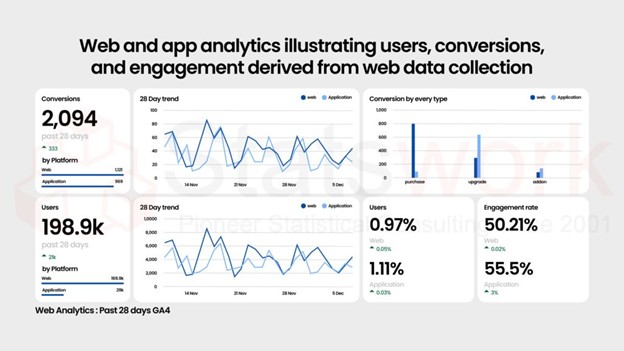
Data Collection Services
- Statistical & Biostatistics services
- Sample Work
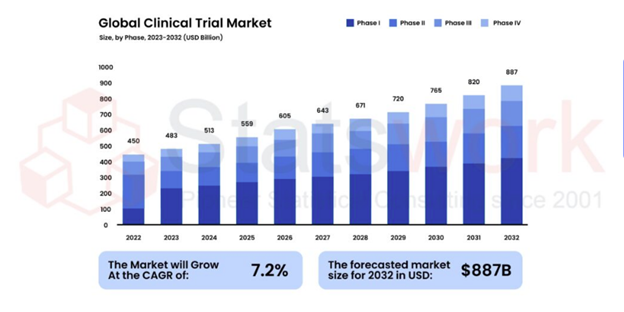
Statistical Programming & Biostatistics services
- Data Management Services
- Sample Work
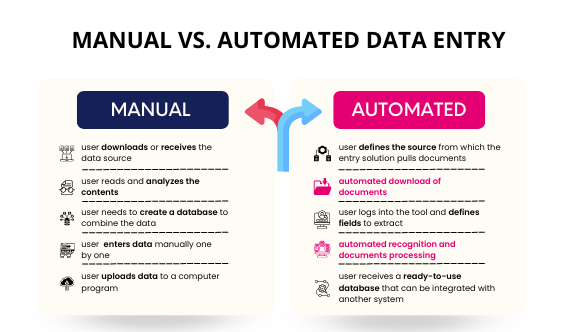
Data Management Services
- Research methodology services
- Sample Work
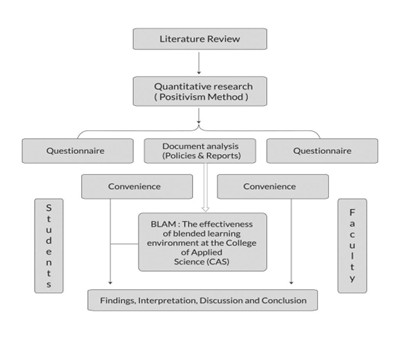
Research methodology services
- Tool Development Services
- Sample Work
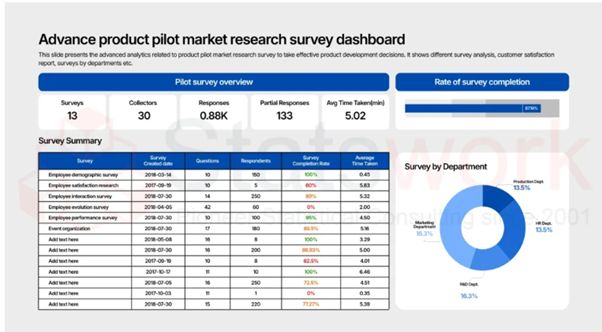
Tool development services
- Statistical Interpretation services
-
Statistical Interpretation services
- Sample Work
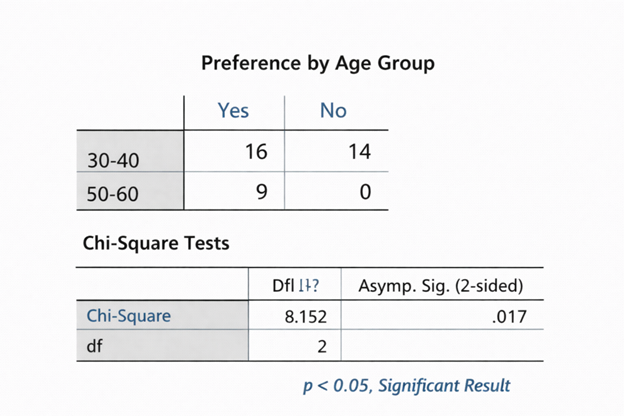
Statistical Interpretation services
-
- Sample Size Calculation Services
-
Sample Size Calculation Services
- Sample Work
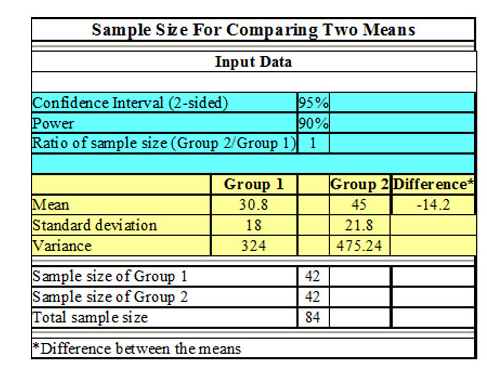
Sample Size Calculation Services
-
- AI & ML Services
-
Artificial Intelligence and Machine Learning Services
- Sample Work
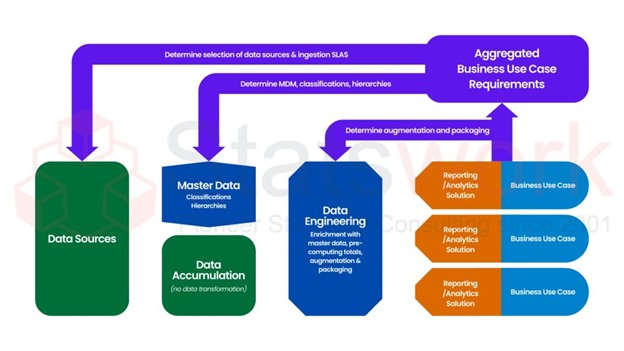
Artificial Intelligence and Machine Learning Services
-
- Meaningful Visualization Services
- Thought Leadership Services
- Report Generation Services
-
Report generation Service
- Sample Work
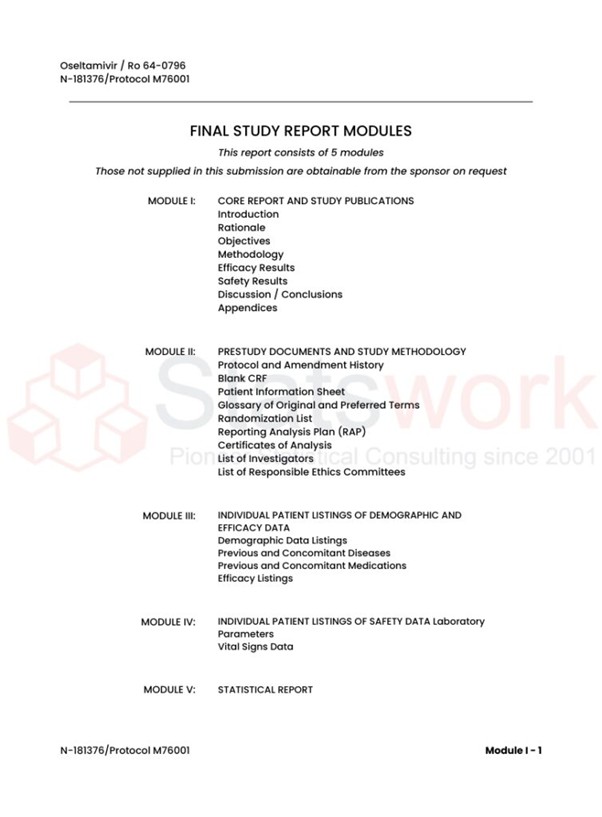
Report generation Services
-
- Data Analysis services
- Industries
- About Us
- Blog
- Insights
- Contact Us
- Services
- Data Analysis services
- Sample Work
Data Analysis services
- Secondary Qualitative Research Services
- Secondary Quantitative Research Services
- Meta-Analysis Research services
- Sample Work
Meta-Analysis Research Services
- Data Collection Services
- Sample Work
Data Collection Services
- Statistical & Biostatistics services
- Sample Work
Statistical Programming & Biostatistics services
- Data Management Services
- Sample Work
Data Management Services
- Research methodology services
- Sample Work
Research methodology services
- Tool Development Services
- Sample Work
Tool development services
- Statistical Interpretation services
-
Statistical Interpretation services
- Sample Work
Statistical Interpretation services
-
- Sample Size Calculation Services
-
Sample Size Calculation Services
- Sample Work
Sample Size Calculation Services
-
- AI & ML Services
-
Artificial Intelligence and Machine Learning Services
- Sample Work
Artificial Intelligence and Machine Learning Services
-
- Meaningful Visualization Services
- Thought Leadership Services
- Report Generation Services
-
Report generation Service
- Sample Work
Report generation Services
-
- Data Analysis services
- Industries
- About Us
- Blog
- Insights
- Contact Us
Not Sure Which Analytical Tool Fits Your Market Research?
Meta Analysis Service
Recommended Reads
Contact us
Summary:
This guide provides insights into choosing appropriate market research tools and analytical techniques based on research needs, data set size, level of expertise, and allocated budget. The article describes the main categories of data analysis (quantitative, qualitative), as well as more complex approaches and techniques that might be used in analyzing the obtained results. Besides, the guide includes information on the most common market research tools, including SPSS, R, Python, Tableau, Qualtrics, NVivo, among others. The article gives an example of a B2B company that was able to conduct research and make appropriate choices in relation to its research needs and data set size.
Market research is a crucial area for many businesses dealing with other businesses (B2B). At the same time, choosing an appropriate research method and tool is not always obvious, especially when there are dozens of various analytical techniques and resources available to understand the target market better. This guide aims to help in selecting the most suitable market research tools and data analysis techniques depending on needs, time constraints, and budgets [1].
Why the Right Analytical Tool Matters
Choosing an analytical instrument which is highly inappropriate for research leads to the loss of precious time and resources.
According to the latest statistical data, the use of an unsuitable tool for the analysis of a survey leads to:
- an average increase in cost of 34%,
- a delay by 45%,
- and the quality of research results is reduced by 22% on average.
The above facts emphasize the importance of choosing an analytical tool that can support both survey processing, statistical analysis, and graphics. It can also be possible to integrate the program into the customer’s existing software environment and technical capabilities and provide opportunities for expanding its use in research [2].
Core Analytical Techniques in Market Research
First, let’s review some of the basic data analysis methods that underpin market research:
Quantitative Analysis
- Descriptive statistics, including mean, median, standard deviation
- Hypothesis testing and confidence intervals
- Regression analysis and tests for correlation
Factor analysis
- Qualitative Analysis
- Thematic coding and content analysis
- Sentiment analysis and text mining
- Network analysis
Advanced methods
- Machine learning
- Conjoint analysis
- Structural equation modeling [3]
Leading Market Research Tools Comparison
| Tool | Best For | Statistical Capabilities | Ease of Use | Price Range | Ideal Team Size |
| SPSS | Descriptive stats & crosstabs | Excellent | Moderate | $1,200-2,500/yr | Small-Medium |
| R/RStudio | Advanced analytics & automation | Expert-level | Steep | Free/Open source | Data-heavy teams |
| Python (Pandas/SciPy) | Custom analysis & scripting | Highly flexible | Technical | Free | Development-focused |
| Tableau | Data visualization & dashboards | Good | Easy | $70-100/user/mo | Cross-functional |
| Qualtrics | End-to-end survey analytics | Comprehensive | Very Easy | Custom enterprise | Large-scale research |
| NVivo | Qualitative data management | Strong | Moderate | $800-1,200/yr | Qualitative teams |
Real-World Implementation: B2B Scenarios
Scenario 1: Rapid Market Sizing Study
A software-as-a-service (SaaS) company requires immediate market segmentation information. Best tools to use: Tableau & Python. Budget: Less than $500. Duration: 2-3 weeks.
Scenario 2: Enterprise Level Client Satisfaction Survey
A B2B services company conducting a survey of more than 500 customers should be focused on powerful statistics tests. Best way to do it: Qualtrics & SPSS. Duration: 4-6 weeks.
Scenario 3: Competitors Content Analysis
A marketing department performing an analysis of more than 1,000 messages from competitors needs automated analysis. Best solution: Python (using NLP libraries) & R. This will help you find some messaging patterns that your team wouldn’t notice manually [4].

Key Decision Factors for Your Organization
1. Data Volume and Complexity
- For smaller datasets, Excel or a statistical package may be sufficient depending on the research objectives and analysis required Medium datasets: 1,000-10,000 respondents—SPSS or Tableau should be used
- Big unstructured datasets—Python/R + machine learning frameworks
2. Team Technical Level
It is directly connected to the tool’s appropriateness:
- Non-technical teams—the choice should be made based on user-friendliness (Tableau, Qualtrics)
- Hybrid teams the choice that offers both GUI and scripting options (RStudio, Python)
- Data scientists teams make sense to choose open-source ecosystem (Python, R) [3]
3. Budget Limitations
B2B companies have drastically different budgets:
- Start-up/bootstrap—open-source tools (R, Python)—$0-500 investment + training
- Mid-market—licensed tools (SPSS, Tableau)—$5,000-$15,000/year
- Enterprise—the full platform (Qualtrics, IBM Analytics)—$50,000-$500,000+/year
4. Integration with other systems
Does your tool integrate with:
- CRM system of your company (Salesforce, HubSpot)?
- Data warehouses you use (Snowflake)
Best Practices for Tool Selection
1. Proof of Concept (POC)
Do not accept any solution without thorough testing. Always perform POCs for each of your 2-3 chosen tools. Use a representative sample of your real data to evaluate efficiency, performance, and analytical output.
2. Consider Total Cost of Ownership
Not only should you consider the cost of purchasing the tool, but also consider additional expenses related to implementation, training, support, and others. Estimate long-term benefits from the perspective of investment.
3. Choose Scalable Solution
Choose a tool that can grow along with you. Sometimes, some solutions can turn out to be too slow or limited for a more complicated task after 18-24 months [4].
4. Ensure Data Security Compliance
In the case of B2B research, you collect and analyze sensitive data about other organizations, thus it is important that a provider complies with all standards of data protection (GDPR, CCPA, SOC 2, and others).
Conclusion: Ready to Transform Your Research?
Selecting the right analytical tool can help organizations improve the efficiency, reliability, and usability of their research. Whether you need advanced statistical software to perform hypothesis testing, conduct research tools comparison or deploy automated market analysis – whatever your needs are, we can help.
Statswork offers professional consultancy and implementation services to B2B companies who wish to achieve superior results in their research efforts by embracing the right data analysis techniques.
Don’t let tool confusion slow your decision-making. Schedule a free 30-minute consultation with our research analytics experts today. We’ll assess your research needs, recommend the perfect tool stack, and show you how to maximize ROI on your analytics investment.
Frequently Asked Questions (FAQs)
Market research can use tools such as SPSS, R, Python, Tableau, Qualtrics, and NVivo for survey analysis, statistical research, data visualization, and qualitative analysis.
Common analytical tools include descriptive statistics, hypothesis testing, regression analysis, correlation analysis, factor analysis, thematic analysis, sentiment analysis, and machine learning.
The best tools depend on research requirements, but SPSS, R, Python, Tableau, Qualtrics, and NVivo are widely suitable for different types of market research.
Examples of analytical tools include SPSS for statistical analysis, Python for custom data analysis, Tableau for visualization, Qualtrics for surveys, and NVivo for qualitative research.
Ten commonly used analytics tools are SPSS, R/RStudio, Python, Tableau, Qualtrics, NVivo, Excel, Power BI, SAS, and MATLAB.
Yes, ChatGPT can assist with data analysis, data interpretation, calculations, visualization, and identifying patterns when relevant datasets and analysis requirements are provided.
References:
- Erickson, G. S. (2026). Marketing research to marketing analytics. Teaching Marketing Analytics, 1-24. https://www.elgaronline.com/edcoll
- Alamsyah, N., Thanasopon, B., & Jamsri, P. (2026). Leveraging Data Analytics Across Digital Product Development Stages: A Systematic Review and Conceptual Framework. Journal of Information Systems Engineering and Business Intelligence, 12(2), 392-413. https://e-journal.unair.ac.id/JISEBI/article/view
- Morris, N., Raines, J., Hicks, B., Gopsill, J., Sanusi, M., Robinson, T., & Price, M. (2026). Inventory of design, engineering and analysis tool environments (IDEATE). Proceedings of the Design Society, 6, 397-406. https://www.cambridge.org/core
- Sung, B., Pitardi, V., Paas, L., & Cartwright, T. (2026). Market Research in the Age of Generative AI: Opportunities and Challenges. International Journal of MarketResearch, 68(2), 153-161.https://journals.sagepub.com/doi