
- Services
- Data Analysis services
- Sample Work
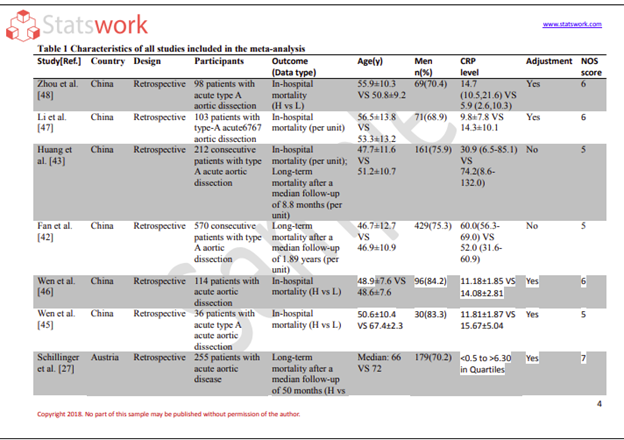
Data Analysis services
- Secondary Qualitative Research Services
- Secondary Quantitative Research Services
- Meta-Analysis Research services
- Sample Work
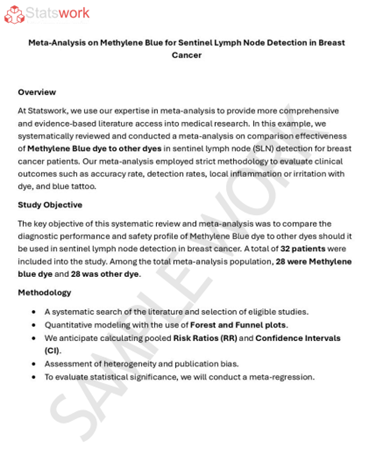
Meta-Analysis Research Services
- Data Collection Services
- Sample Work
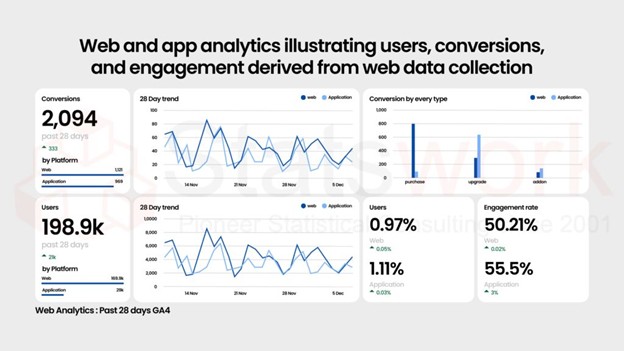
Data Collection Services
- Statistical & Biostatistics services
- Sample Work
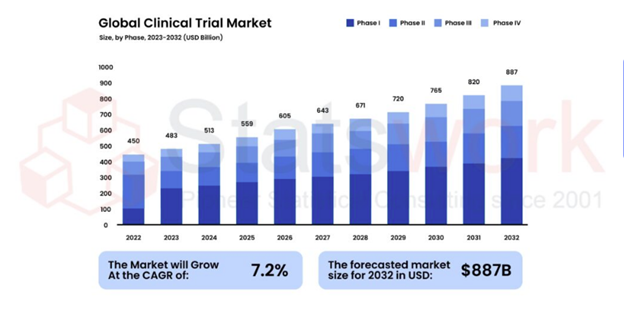
Statistical Programming & Biostatistics services
- Data Management Services
- Sample Work
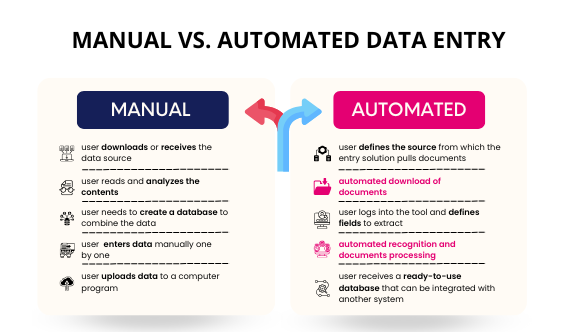
Data Management Services
- Research methodology services
- Sample Work
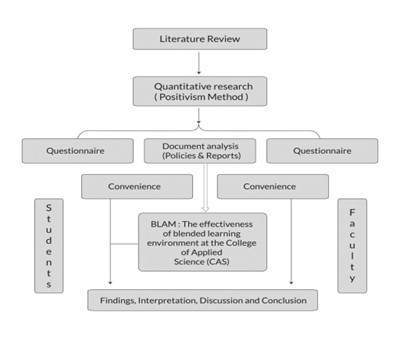
Research methodology services
- Tool Development Services
- Sample Work
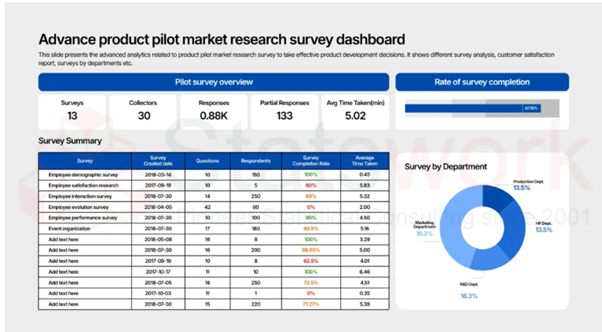
Tool development services
- Statistical Interpretation services
-
Statistical Interpretation services
- Sample Work
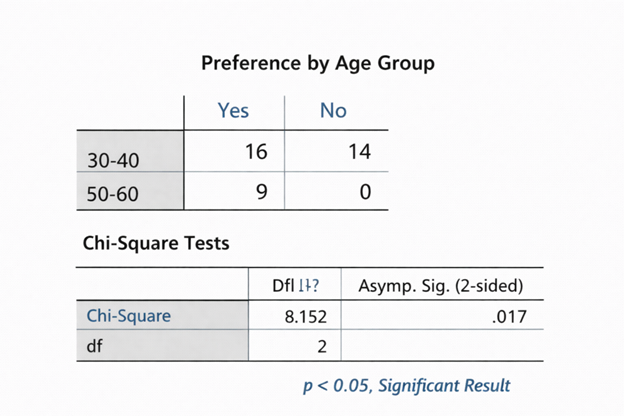
Statistical Interpretation services
-
- Sample Size Calculation Services
-
Sample Size Calculation Services
- Sample Work
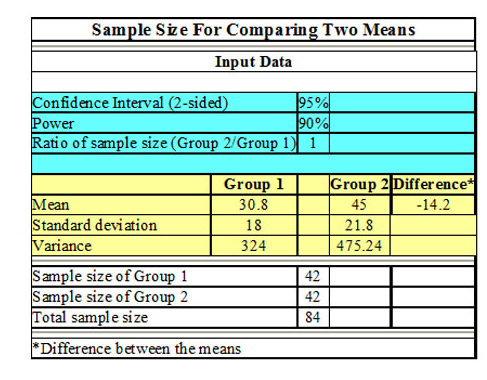
Sample Size Calculation Services
-
- AI & ML Services
-
Artificial Intelligence and Machine Learning Services
- Sample Work
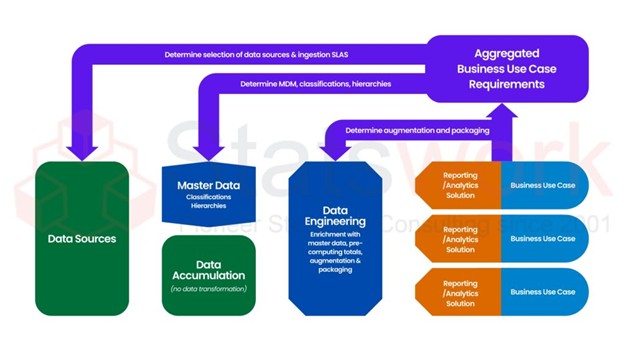
Artificial Intelligence and Machine Learning Services
-
- Meaningful Visualization Services
- Thought Leadership Services
- Report Generation Services
-
Report generation Service
- Sample Work
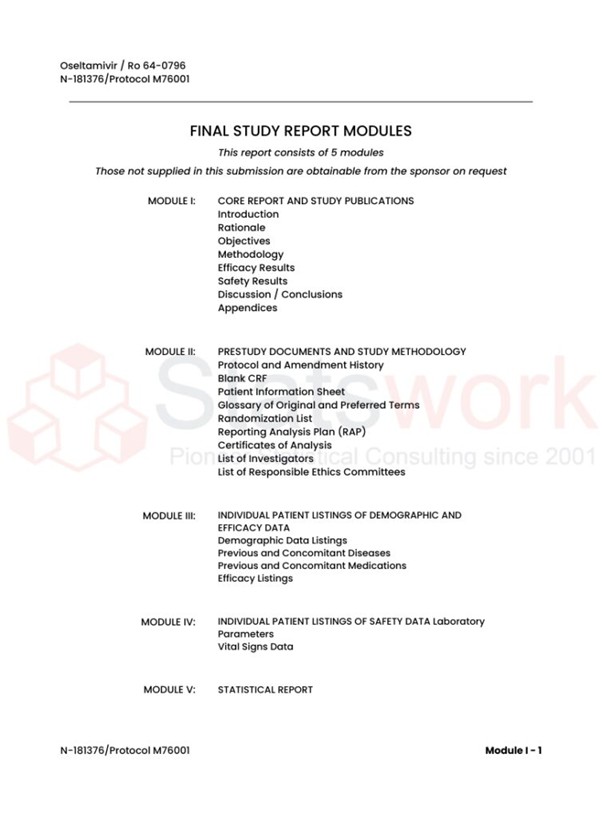
Report generation Services
-
- Data Analysis services
- Industries
- About Us
- Blog
- Insights
- Contact Us
- Services
- Data Analysis services
- Sample Work
Data Analysis services
- Secondary Qualitative Research Services
- Secondary Quantitative Research Services
- Meta-Analysis Research services
- Sample Work
Meta-Analysis Research Services
- Data Collection Services
- Sample Work
Data Collection Services
- Statistical & Biostatistics services
- Sample Work
Statistical Programming & Biostatistics services
- Data Management Services
- Sample Work
Data Management Services
- Research methodology services
- Sample Work
Research methodology services
- Tool Development Services
- Sample Work
Tool development services
- Statistical Interpretation services
-
Statistical Interpretation services
- Sample Work
Statistical Interpretation services
-
- Sample Size Calculation Services
-
Sample Size Calculation Services
- Sample Work
Sample Size Calculation Services
-
- AI & ML Services
-
Artificial Intelligence and Machine Learning Services
- Sample Work
Artificial Intelligence and Machine Learning Services
-
- Meaningful Visualization Services
- Thought Leadership Services
- Report Generation Services
-
Report generation Service
- Sample Work
Report generation Services
-
- Data Analysis services
- Industries
- About Us
- Blog
- Insights
- Contact Us
Analysis of variance (ANOVA)
Meta Analysis Service
- Why do businesses need ANOVA?
- Understanding ANOVA Types & Assumptions
- Critical ANOVA Assumptions You Must Verify
- ANOVA Analysis: Key Statistical Concepts Explained
- Real-World ANOVA Example for Business Data
- Post-Hoc Tests: Understanding Which Groups Differ
- Why Hire Statistical Analysis Experts?
- How Statswork Delivers ANOVA Consulting Excellence
- Things to Note About ANOVA
Recommended Reads
Contact us
Summary:
ANOVA is a statistical technique that allows one to find differences among means of three or more groups. ANOVA is used by companies in such areas as market research, customer satisfaction, marketing campaigns, product performance, and quality assessment. This process includes making sure about correct assumptions, choosing the right type of ANOVA, conducting post-hoc tests, and assessing effect size. ANOVA consulting helps in attaining accurate analysis and informed decision making.
ANOVA, short for Analysis of Variance, is a strong statistical tool that helps compare means between several groups. For project management in any kind of research or in a business environment, it becomes very important to know about ANOVA analysis. While t-tests are used for comparing means between two groups, ANOVA is used for comparing means between three or more groups.
The basic concept of ANOVA is quite simple, which involves testing the null hypothesis that the means of all the groups are equal. The F-statistic or F-test is used for testing whether there is a statistically significant difference between the means [1].
Why do businesses need ANOVA?
- Comparison of product performance in multiple markets
- Satisfaction level of customers in different demographics
- Marketing campaign analysis
- Analysis of quality difference in manufacturing process
Understanding ANOVA Types & Assumptions
Main Types of ANOVA Analysis
| ANOVA Type | Application | Characteristics |
| One Way ANOVA | Analysis of a single independent variable in three or more groups | Standard type |
| Two Way ANOVA | Analysis of two independent variables at the same time | Main effects and interaction effects |
| Repeated Measure ANOVA | Measurements on the same subjects over several occasions | Within-subject design |
| Factorial ANOVA | Analysis of multiple independent variables and their levels [[2](https://analyticalsciencejournals.onlinelibrary.wiley.com/doi/full/10.1002/cem.70151)] | Experimental design |
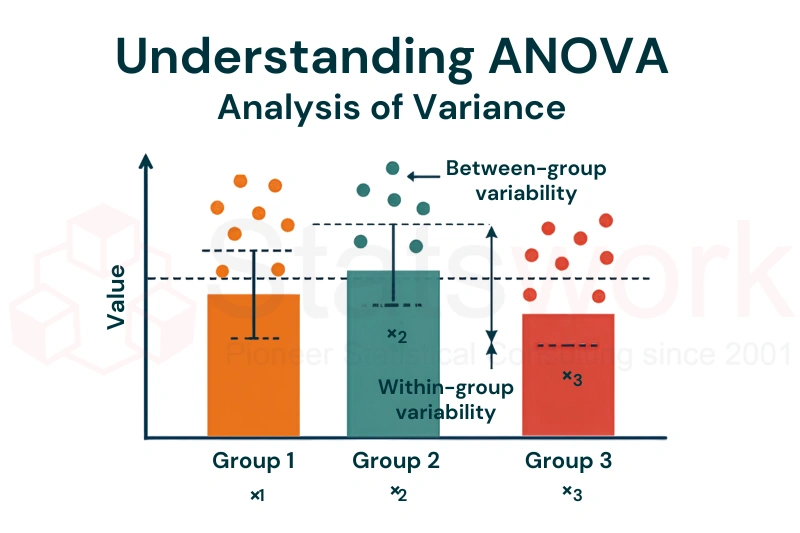
Critical ANOVA Assumptions You Must Verify
Prior to conducting statistical analysis outsourcing and/or testing, ensure that the following assumptions are satisfied:
✓ Independence of Observations – Data points are independent, no autocorrelation
✓ Normality – Residuals follow a normal distribution in each group
✓ Homogeneity of Variance – Equally variances for all groups (the Levene’s test ensures this)
✓ Interval/Ratio Data – Continuous dependent variable, not categorical
✓ Random Sampling – Groups have been selected randomly from populations [3]
Consequences of Assumptions Violation: In case assumptions are violated, there are robust statistical tests, including Welch’s ANOVA and Brown-Forsythe test, both provided by corporate statistical analysis outsourcing service providers.
ANOVA Analysis: Key Statistical Concepts Explained
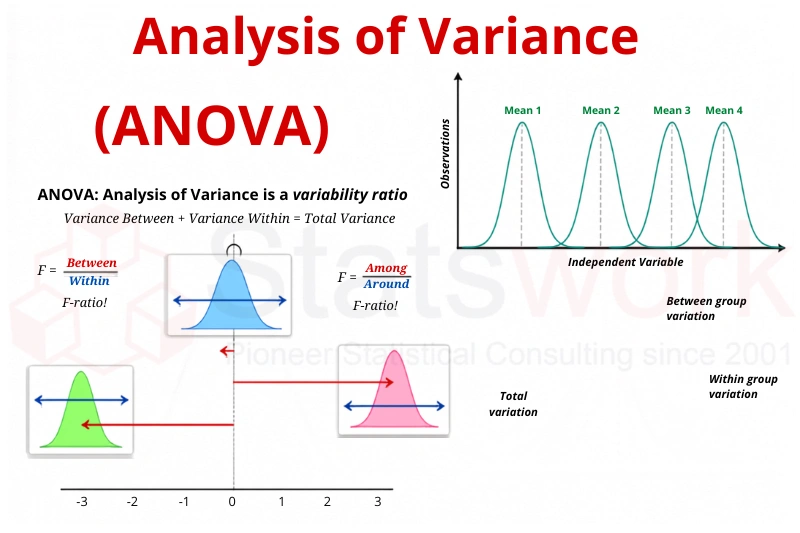
F-test determines the ratio between the variance within groups and the variance between groups:
F-statistics = Variance between groups / Variance within groups
Higher values of F show large variances between the groups. The p-value shows statistical significance of results (usually, p-value below 0.05 shows statistical significance).
Degrees of Freedom
Degrees of freedom influence the validity of the tests:
- Degrees of freedom (between-groups) = Number of groups – 1
- Degrees of freedom (within-groups) = Total number of observations – Number of groups
Real-World ANOVA Example for Business Data
Scenario: Market Research Analysis
A retail organization wants to conduct analysis comparing the average expenditure made by customers in each of the four regions (North, South, East, and West) over a period of six months [4].
Data Structure:
- Region North: $450, $475, $490, $465, $520 (Mean = $480)
- Region South: $380, $395, $410, $425, $418 (Mean = $406)
- Region East: $510, $525, $530, $545, $560 (Mean: $534)
- Region West: $440, $455, $460, $475, $485 (Mean: $463)
ANOVA Results:
| Source | Sum of Squares | df | Mean Square | F-statistic |
| Between Groups | 28,640 | 3 | 9,547 | 18.32 |
| Within Groups | 8,320 | 16 | 520 | — |
| Total | 36,960 | 19 | — | — |
Interpretation: The F-statistics of 18.32 with p-value = 0.001 indicates statistically significant differences in spending across regions.
Post-Hoc Tests: Understanding Which Groups Differ
In case of significant differences in ANOVA results, post-hoc tests will help us detect individual group differences:
| test | Better for | Reason |
| Tukey HSD | Equally sized samples | Conservative; avoids Type I error |
| Bonferroni | Several comparisons | Simple; easy to understand |
| Scheffe Test | Different sized samples | Adaptable; flexible |
When ANOVA reveals significant differences, post-hoc tests identify specific group differences:
Effect Size: Measuring ANOVA Practical Significance
Whereas the P value signifies the statistical significance, eta squared is an indication of practical significance:
η²=Between group variance/Total variance
- η²= 0.01 = Small effect
- η²= 0.06 = Moderate effect
- η²= 0.14 = Large effect
From our example involving retail stores, eta-squared ≈ 0.77, which shows a very large effect size since spending differences between regions are statistically and practically significant [3].
Why Hire Statistical Analysis Experts?
Common ANOVA Challenges Businesses Face
❌ Incorrect interpretation of p-value and effect size
❌ Assumption violation without its detection
❌ Choice of improper ANOVA variant depending on data structure
❌ Lack of understanding of requirements for post-hoc tests
❌ Inappropriate business conclusions
Solution: Collaborate with professionals in statistics for statistical analysis services in companies.
How Statswork Delivers ANOVA Consulting Excellence
Our statistical consulting for business data ensures:
- Validation of Assumptions – Thorough testing before conducting the analysis
- Proper Choice of Test – One-Way, Two-Way, or Mixed ANOVA depending on your design
- Strong Analysis – Welch’s ANOVA/Brown-Forsythe when required
- Interpretation of Results – Statistical insights that make business sense
- Professional Reporting – Publishable results with interpretation
ANOVA Statistical Analysis Outsourcing
If your project requires market research analysis, quality control analysis, or consumer satisfaction analysis, outsourcing the task saves time and money [4].
Things to Note About ANOVA
- The means of different groups are compared using F statistics in ANOVA
- The importance of assumptions should be understood – normality, independence, and variance homogeneity need to be checked
- The types of ANOVAs can be one-way, two-way, repeated measure, and factorial
- The post hoc tests help identify the differences among the groups after performing ANOVA
- The effect size (eta squared) explains the significance of the findings practically
Expert deliverances prevent mistakes in the analysis process
Act: Get Free Expert ANOVA Analysis Consultation
Don’t let statistical uncertainty impact your business decisions. Hire a statistician from Statswork for accurate ANOVA analysis and expert-led corporate statistical consulting.
Contact our team today for:
- Free ANOVA feasibility assessment
- Custom statistical analysis proposal
- Experienced statistical consultants ready to support your project
Frequently Asked Questions (FAQs)
Analysis of Variance (ANOVA) is used to determine whether there are statistically significant differences between the means of three or more groups.
ANOVA stands for Analysis of Variance, a statistical method used to compare group means.
For example, ANOVA can be used to compare the average test scores of students taught using three different teaching methods to determine whether the methods produce significantly different results.
ANOVA is calculated by comparing the variation between groups with the variation within groups to obtain an F-statistic, which is then used to determine statistical significance.
The main types of ANOVA include one-way ANOVA, two-way ANOVA, repeated-measures ANOVA, and mixed ANOVA.
To calculate ANOVA by hand, calculate the group means and overall mean, determine the between-group and within-group variations, calculate their degrees of freedom and mean squares, and then obtain the F-statistic.
References:
- Cai, Y., & Lee, E. S. (2026). Analysis of variance. Translational Plastic Surgery, 149-152. https://www.sciencedirect.com
- Camacho, J., Ezenarro, J., Schorn‐García, D., & Westerhuis, J. A. (2026). From design of experiments to analysis of variance of multivariate data: a tutorial review on ANOVA simultaneous component analysis.Journal of Chemometrics, 40(6), e70151. https://analyticalsciencejournals.
- Madadizadeh, F., & Bahariniya, S. (2026). A Review of Analysis of Variance Designs and their Applications in Infection, Epidemiology, and Microbiology Research. The Open Microbiology Journal, 20(1). https://openmicrobiologyjournal.com
- Dey, A., Dey, S., Jana, G. G., Datta, R., & Sadhu, A. (2026). Optimization of Process Parameters Using ANOVA: A Review. Experimental Design of Bio-Inspired Algorithms for Optimization Problems in Industry 5.0, 20-28. https://www.benthamdirect.com