Forest plot
Forest plot of the five included studies that quantitatively assessed the association between DM and culture confirmed Tuberculosis

Figure 4.1: Forest plot of the five included studies that quantitatively assessed the association between DM and culture confirmed Tuberculosis
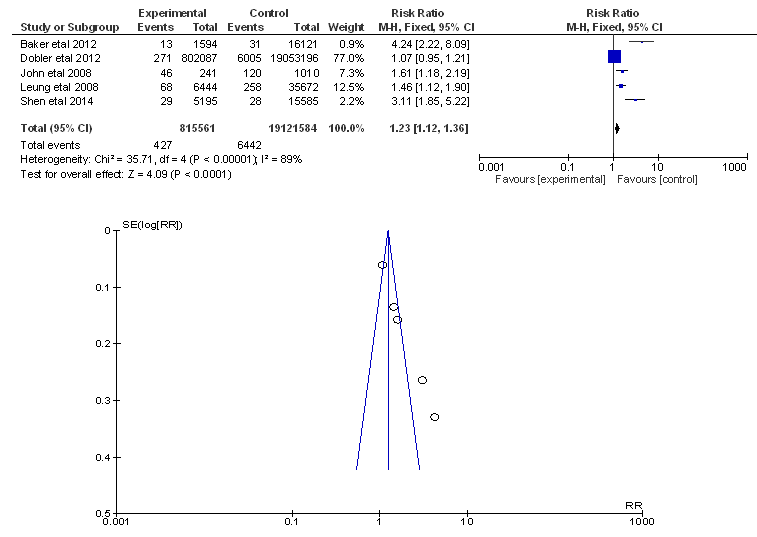
Figure 4.1 summarizes the adjusted effect estimates of the Optimal (3500-4500g) and Above Optimal (>4500g)
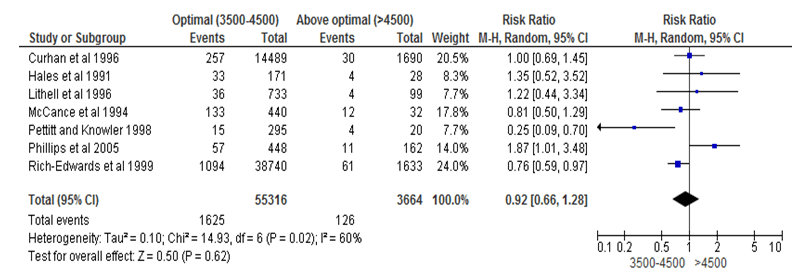
Figure 4.4 Forest plot for comparison between optimal (3500g-4500g) and below optimal (>4500g) birth weight