
Results and Interpretation
Results
Results
Table1: Frequency of respondents age-group in years (n=300)
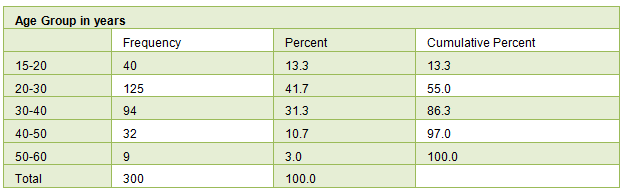
The above tTable1 shows the frequency of age group in years. The age group has been divided into five groups as mentioned in the above table. It shows that almost 41.7% of the participants belongs to 20-30 years age group followed by 31.3% of the participants are from 30-40 years. Further, 13.3% belongs to 15-20 years and 10.7 % belongs to 40-50 years. The least was 50-60 years age group who contributed only 3% of the total participants.
Table 2: Frequency of gender (n=300)
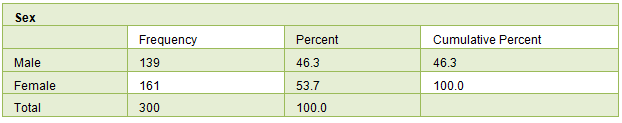
The above table 2 shows the frequency of gender participated in the study,. The above table reveals that 53.7% of the participants belongs to female followed by 46.3% of the participants are male. Thus, almost both male and female paticipated equally.
Table 3:
Frequency of Location
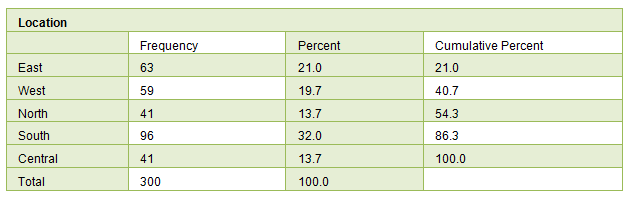
The above table 3 shows the frequency of location. The table showed that the south represented higher percentage (32.0%), followed by east (21.0%). Similarly, for the West(19.7%), North(13.7%), and Central(13.7%). The locations of South, was getting the highest value of percent at 32%, North and Central were getting lower values of percent at 13.7%.
Table 4: Frequency of Education (n=300)

From the above table 4, have the Education levels of Matriculation, the percent was 3.3%. Same pattern, has the Higher Secondary(15.3%), graduate(42.7) and Post-Graduate(38.7%). Further the highest and lowest levels of Education the Graduate and Post-Graduate getting the percents was 42.7% and 38.7%.
Table 5:
Frequency table respondent to Occupation
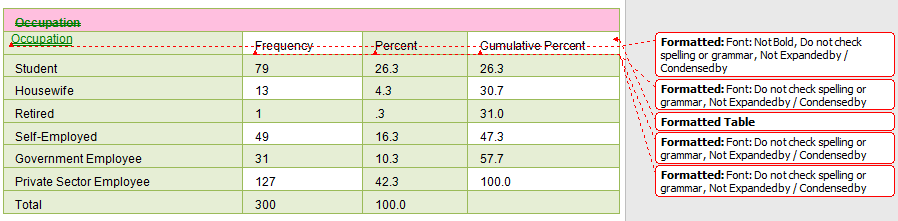
From the above table 5 discussing occupation – for the students, the level of frequency is 79 and the percent was 26.3%. However, the Housewife(26.3), Retried(31.0), Self-Employed(47.3), Government Employee(57.7) and Private Sector Employee(57.7). The higher and lower levels were found to be for the Private Sector Employee and Student, with percent levels at 42.3% and 26.3%.
Table 6:
Respondent to Income
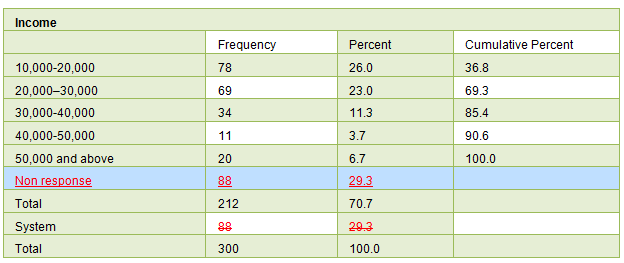
The above table 6 shows the Income of employees ranging from 10,000 to 50,000 and above. It was shown that, the number of employees with income ranging from 10,000 to 20,000 INR contributed a highest percentage of 26. A least percentage of 3.7 was contributed by the employees whose income ranged between 40,000 - 50,000.
Table 7:
Frequency table respondent to Have Phoochka(Y/N)
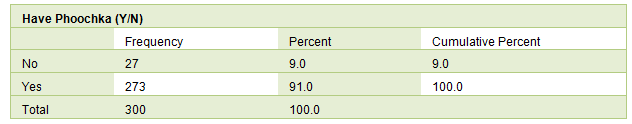
The above table shows the frequency of people having phoochka. People who showed interest (Yes) in having phoochka contributed to frequency of 273(91%). People who are not having phoochka showed a frequency level of 27(9%).
Graph:
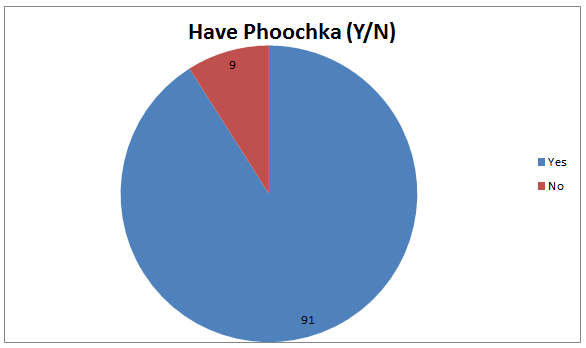
From the above graph, people interested to Have Phoochka Yes, this got the higher level of frequency and precent is 273 and 91%
Table 8:
Relationship between Age Group * Have Phoochka (Y/N)
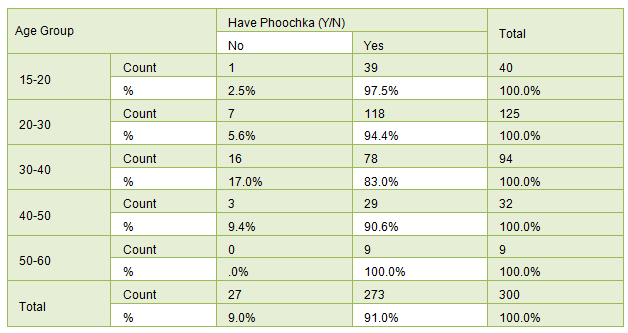
From table above, discusses the relationship between age group and having phoochka. This table reveals that the age group of 50 – 60 years, 100.0% of the participants had Phoochka and the level gradually decreases has a age group decreases. However, the lowest prevelance of having phoochka has noted in 30-40 years of age group has 17%, of the respondent revealed that they do not have phoochka and this relationship was significant at p=0.017. * chi-square value is 12.108 with 4 degress of freedom.
Table 9:
Relationship between Sex * Have Phoochka (Y/N)
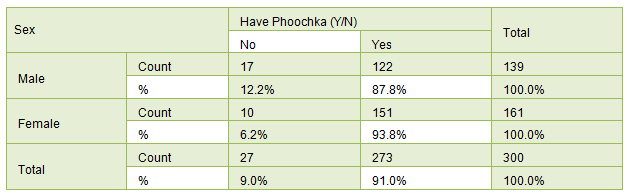
The table above, discusses the relationship between sex and have phoochka. For both male and female have 87.8% and 93.8% had phoochka. Similarly, the male and female participants do not have phoochka the level of percent was 12.2% and 6.2%, and this relationship was significant at p=0.069. * chi-square value is 3.300 with 1 degress of freedom.
Table 10:
Relationship Between Location * and Phoochka intake
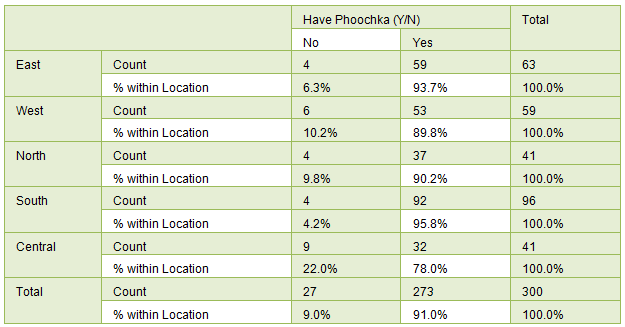
The table above, discusses the relationship between people having phoochka and their location . People from the south having phoochka showed highest percentage of 95.8 and a lowest of 78% was contributed by people from the central location. Similarly, its gradually decreases in Central location it percent was 78.0%.In the locations of central and south getting the higher and lower levels of percent was 22.0% and 4.2% showed that they do not have phoochka and this relationship was significantly at p=0.019. * chi-square value is 11.803 with 4 degress of freedom.
Table 11:
Relationship Between Education * Have Phoochka (Y/N)
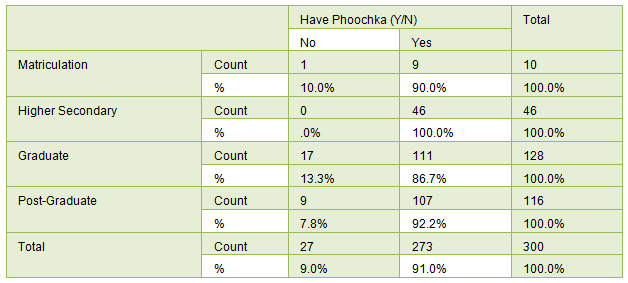
The table above, discusses the relationship between location and have phoochka.The table reveals that the education of Higher Secondary 100.0% of participants had phoochka, and the level of gradually decreases has a education decreases.However, the lowest prevalance of the having phoochka has noted in Graduates of education has 13.3%, of the respondent revealed that they do not have phoochka and this relationship was significant at p=0.054. * chi-square value is 7.645 with 3 degress of freedom.
Table 12:
Relationship Between Occupation * Have Phoochka (Y/N)
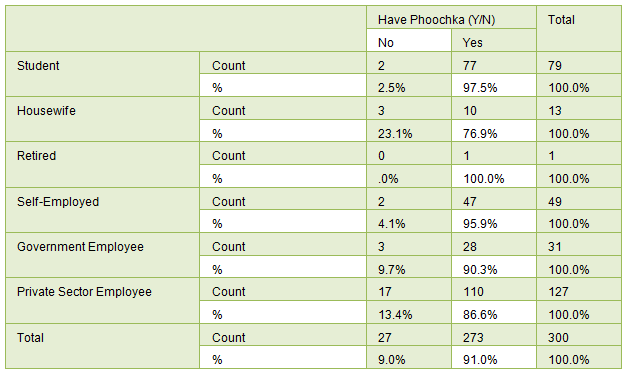
The table above, discusses the relationship between location and have phoochka.The reveals that the retired participants 100.0% had phoochka, and the level gradually decreases has a location decreases. However, the lowest prevelance of having phoochka has noted in 23.1% of the respondent revelead that they do not have phoochka and this relationship was significant at p=0.039. * chi-square value is 11.728 with 5 degress of freedom.
Table 13:
Relationship between Income * Have Phoochka (Y/N)
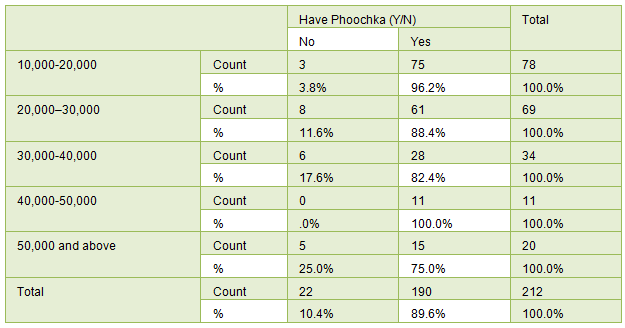
The table above, discusses the relationship between income and have phoochka. The table reveals that the income 40,000-50,000 tye 100.0% of participants had phoochka and the levels gradually decreased has a income decreases. However, the lowest prevelance of having phoochka has noted in 50,000 and above income has 25.0% of the respondent revealed that they do not have phoochka and this relationship was significant at p=0.022 * chi-square value is 11.491 with 4 degress of freedom.
Table 14:
Use of Phoochka as Snack:
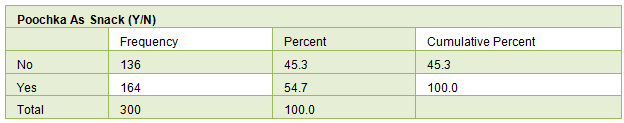
From the above table 14, discusses poochka as snack, for participants had poochka snack the frequency level was 136 and the percentage was 45.3. Similarly, the participants who did not had poochka, the frequency and percentage was 164 and 54.7 respectively.
Table 15:
Frequency of eating
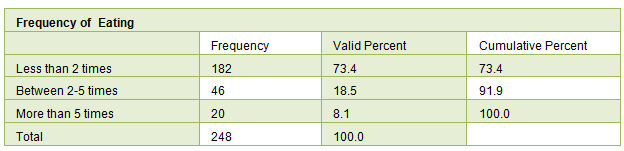
The table above discusses the frequency of eating. The frequency of participants eating less than 2 times was 182 and the percent 73.4%. Similarly, for those participants between 2-5 times and more than 5 times the frequency was 46 and 20. From this was followed, all others participants the percent level was 18.5% and 8.1%.
Graph:
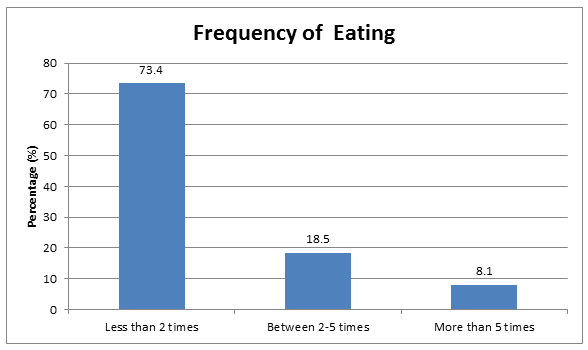
From above graph, the frequency of eating the participants was getting the highest value of percent at 73.4%.
Table 16:
Like Phoochka
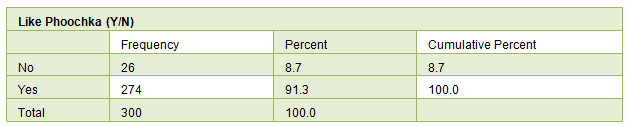
The above table shows the frequency of people interested in having phoochka. People who like having phoochka contributed to frequency of 274(91.3%). People who don’t like Phoochka showed a frequency level of 26(8.7%).
Table 17:
Phoochka Quality Satisfied (Y/N)
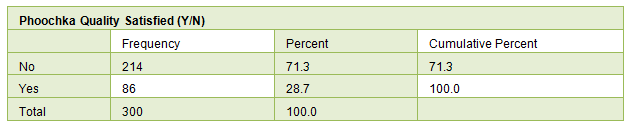
The above table, shows people satisfaction towards phoochka quality. This table revealed that about 71.3% were not satisfied with the phoochka quality which marked frequency of 214, however 28.7% were satisfied with the poochka quality showing frequency of 86.
Table 18:
Current Phoochka Price(Rs.)
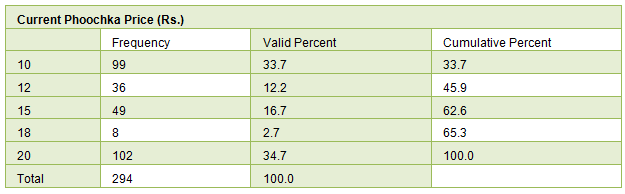
The above table shows the Current Phoochka price. It was shown that the current price of Rs. 10,the percentage was 33.7 respectively. However, the prices of 12(12.2%), 15(16.7%), 18(2.7%) and 20(34.7%). The higher and lower price levels were found to be 20 and 10 for phoochka with percentage of 34.7 and 33.7.
Table 19:
Imported of Branded Snack
From the above table 19, have the imported of branded snacks of <=20% the percentage was 0. Same pattern, has the Between 20% - 50%(35.3%), Between 50% - 70%(48.3%), 100%(9.7%) and Not at all(6.7%) the imported branded snack with the percentage levels. The higher and lower levels were found to be between 20% - 70% and <=20% for branded snack with percentage was 48.3 and 0% respectively.
Table 20:
Imported of Healthy Snack
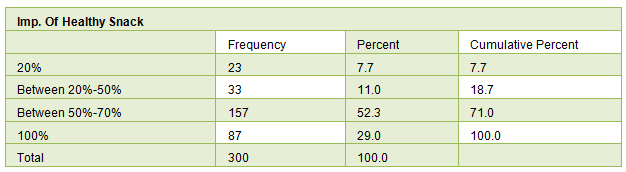
From the above table 20, have the imported of healthy snacks of 20% the percentage was 7.7. Similarly, Between 20% - 50%(11%), Betwen 50% - 70%(52.3%), 100%(29%) the people who are bought the imported branded snack, with percentages respectively. The higher and lower levels were found to be between 50% - 70% and 20% for imported of healthy snack with percentage was 52.3 and 7.7 respectively.
Table 21:
Phoochka from Branded Store(Y/N)
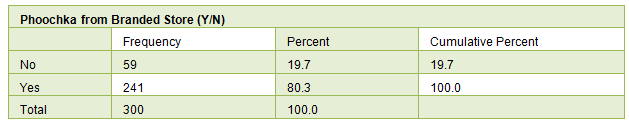
From the above table 21, discusses people who are get the poochka from branded store. People who showed interest in having phoochka in branded store its contributed to frequency of 241(80.3%). People who are not having phoochka from the branded stores showed a frequency level of 59(19.7%)
Table 22:
Expectation from branded Phoochka
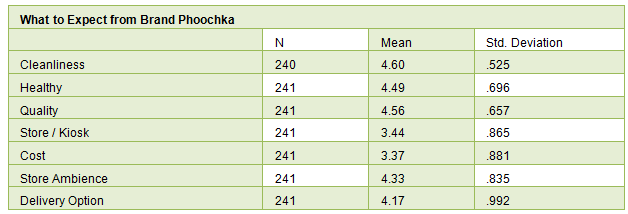
The above table 22, discusses what to expect from brand Phoochka. The mean of the variable for cleanliness for the particular sample of expect brand Phoochka is 4.60, which is significantly different from the value of 300. Similarly, the mean of other variables like healthy(4.49), quality(4.56), store/kiosk(3.44), cost(3.37), store ambience(4.33) and delivery option(4.17), this are all for the particular samples of brand Phoochka, its significantly different from the value of 300 respectively.
Table 23:
Mode of Branded Phoochka Advertisement
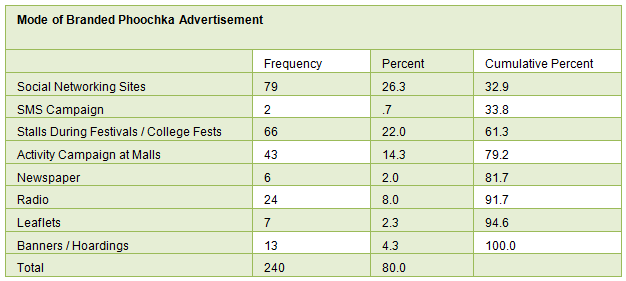
From the above table 23, have the mode of branded phoochka advertisement of social networking sites, the percentage was 26.3. Its was followed by, mode of branded phoochika advertisement of SMS Campaign(0.7%), Stalls During festivals / College fests(22%), Activity campaignat malls(14.3%), Newspaper(2%), Radio(8%), Leaflets(2.3%) and Banners / Hoardings(4.3%) respectively. The Mode of branded phoochka advertisement is Social Networking and SMS Campaign, got the highest and lowest percentage levels of 26.3 and 0.7 were seen.
Table 24:
Flavours in phoochka
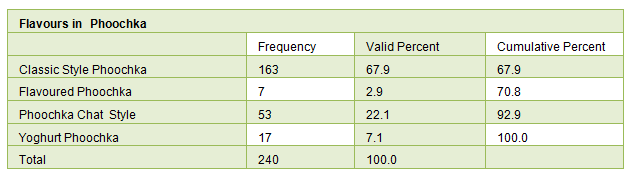
From the above table 24, discusses the Flavour in phoochka, this table reveales that the flavours of Classic style phoochka the percentage 67.9. However, the Flavoured phoochka(2.9%), Phoochka chat style(22.1%) and yoghurt phoochka(7.1%) respectively.In Classic style phoochka and Flavoured phoochka getting the highest and lowest level of percentage was 67.9 and 2.9 respectively.
Table 25:
Health important to phoochka
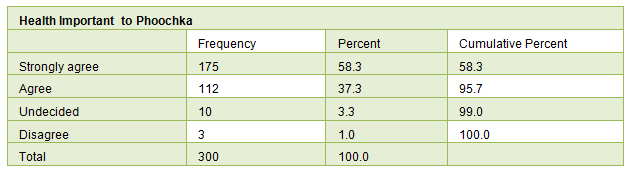
From the above table 25, discusses the Health important to Phoochka, for Strongly agree the percentage level was 58.3. It followed by people who are Agree(37.3%), Undecided(3.3) and Disagree(1%) respectively. The Health important to phoochka of Strongly agree and Disagree was getting the highest the lowest value of percent at 58.3% and 1.0% respectively.
Table 26:
Packaged Drinking Water in Phoochka
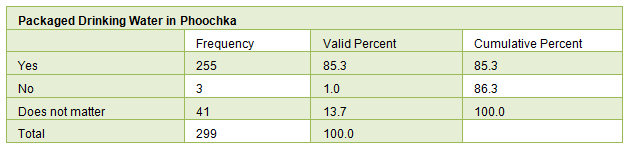
From the above table 26, discussing the Packaged Drinking Water in phoochka, for the participants wanting packaged drinking water in phoochka, the frequency level and percentage was 255 and 85.3 respectively.However, the persons who do not had the packaged drinking water and some people said that doesn’t have matter of the packaged drinking water in phoochka the frequency and the percentage level was 3 & 41 and 1.0 & 13.7.
Table 27:
Hygiene in Phoochka (Glove usage)
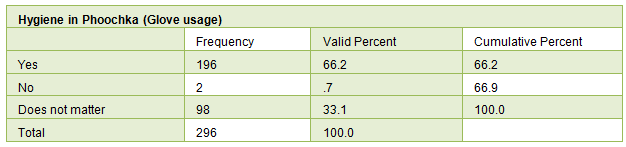
From the above table 27, discussing the Hygiene in phoochka (Glove usage). This table reveals that the participants wants hygiene in phoochika, the frequency level and percentage was 196 and 66.2 respectively. However, the persons who do not had the hygiene in phoochika and some people says that does not have matter of hygiene in phoochka, if the frequency and the percentage level was 2 & 98 and 0.7 & 33.1 respectively.
Table 28:
Hygiene in Phoochka (Mask usage)
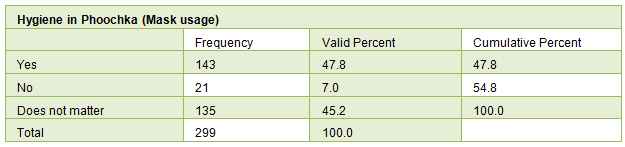
From the above table 28, have the Hygiene in phoochka (Mask usage). The table reveals that the participants had hygiene in phoochika (mask usage), the frequency level and percentage was 143 and 47.8 respectively. However, the persons who do not had the hygiene in phoochika and some people says that does not have matter of hygiene in phoochka in mask usage, if the frequency and the percentage level was 21 & 135 and 7.0 & 45.2 respectively.
Table 29:
Maximum Price for 8 Piece Phoochka
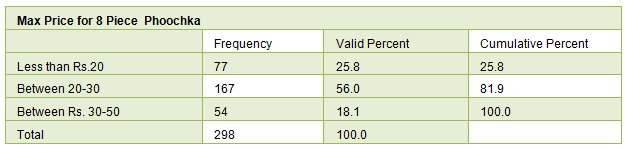
From the above table 29, have the Max price for 8 piece phoochka of less than Rs.20 the frequency level and the percentage was 77 and 25.8 respectively. Same pattern, has the Between Rs.20 – 30 and Betwen Rs.30 – 50, the frequency and percentage levels of 167 & 54 and 56.0 & 18.1 respectively. The higher and lower levels were found to be between Rs.20 – 30 and between Rs.30 - 50 for maximum price with percentage was 56.0 and 18.1 respectively.
Table 30:
Consider everything about Phoochka, which statement best describes how much you like or dislike Phoochka overall?
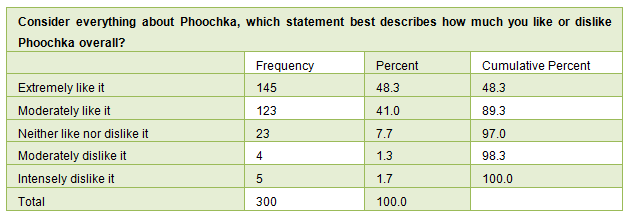
From the above table 30 discussing Consider everything about phoochka, which statement best describes how much you like or dislike phoochka overall? – for the Extermely like it, the frequency and percentage level of 145 and 48.3. However, the Moderately like it(41%), Neither like nor dislike it(7.7%), Moderately dislike it(1.3) and Intensely dislike it (1.7) respectively. The higher and lower levels were found to be for the Extremely like it and Moderately dislike it, with percent levels at 48.3% and 1.3% respectively
Table 31:
What Influences to have Phoochka
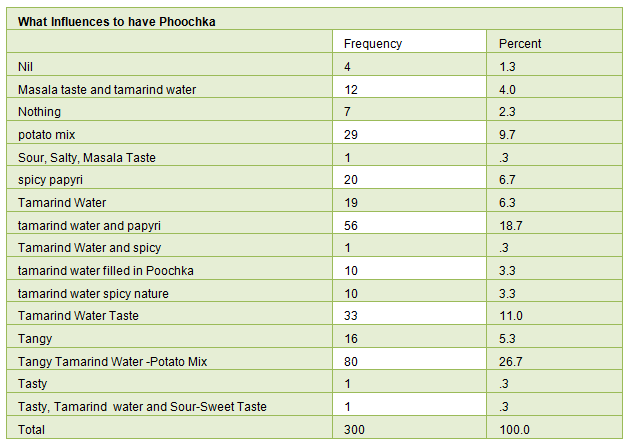
The above table, discussing What influences to have phoochka. The nil level of frequency and percentage was 4 and 1.3% respectively. However, the (Masala taste and tamatind water)(4%), (Nothing)(2.3%), (Potato mix)(9.7%), (Sour, Salty, Masala taste)(0.3%), (spicy papyri)(6.7%), (Tamarind water)(6.3%), (Tamarind water and papyri)(18.7%), (Tamarind water and spicy)(0.3%), (Tamarind water filled in poochka)(3.3%), (Tamarind water spicy nature)(3.3%), (Tamarind water taste)(11%), (Tangy)(5.3), (Tangy tamarind water-potato mix)(26.7), (Tasty)(0.3%) and (Tasty, Tamarind water and Sour-Sweet taste)(0.3%) The higher level were found to be for the (Tangy Tamarind Water -Potato Mix) with percent levels at 26.7%, followed by – (Sour, Salty, Masala Taste), (Tamarind Water and spicy), (Tasty) and (Tamarind water and Sour-Sweet Taste) were getting lower values of percent at 0.3%.
Table 32:
Not Satisfied Why?
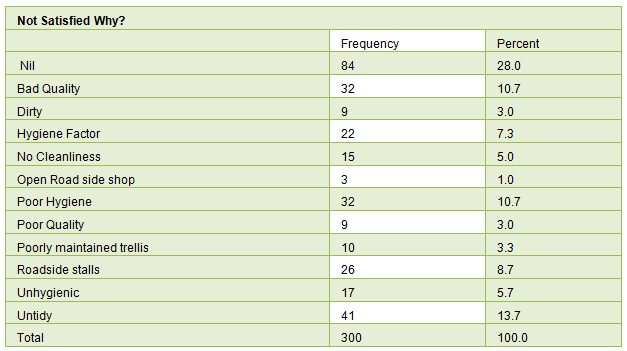
From the above table 32, the participants who never satisfied with phoochka. The nil level percentage was 28.0. Similarly, Bad quality(10.7%), Dirty(3.0), Hygiene factor(7.3), No cleanliness(5%), Open road side shop(1%), poor hygiene(10.7%), Poor quality(3%), poorly maintained trellis(3.3%), Roadside stalls(8.7%),Unhygienic(5.7%) and Untidy(13.7%) The higher and lower levels were found to be for the nil level and open road side shop, with percent levels at 28.0% and 1.0% respectively.