
Discriminant Function Analysis Services from Experts at Stats work
Our statistical analysts at Statswork are well-experienced in handling discriminate function analysis where we use it to find out the relationship between continuous scale variables and categorical variables.
Discriminant Function Analysis Services from Experts at Stats work
Our statistical analysts at Statswork are well-experienced in handling discriminate function analysis where we use it to find out the relationship between continuous scale variables and categorical variables. This analysis is similar to regression analysis but differs in the regression analysis unobserved (dependent) variable which should be on a continuous scale whereas indiscriminate function analysis, unobserved variable presents in categorical variable and observed variables may be continuous or categorical scale.
For ex., In clinical study, the researcher might predict whether patients relieved from heart disease or not based on the demographical details and various treatments. Here the observed (independent) variables may be age, sex, how long have the patients been affected this disease (affected period) and various treatments. For the above analysis, the data should be in the following manner
- Data is a random sample
- Each independent variable should follow the normal distribution
- Dependent variable should be categorical scale
- Independent variable may be categorical or continuous scale
Discriminant function analysis – How our output will be?
One of the recent project what we did for the discriminate function analysis is as follows. The researcher would like to predict the organized and unorganized retailers based on the factors namely, (i) supply chain planning, (ii) sourcing and procurement and (iii) supply chain execution
Tests of equality of group means:
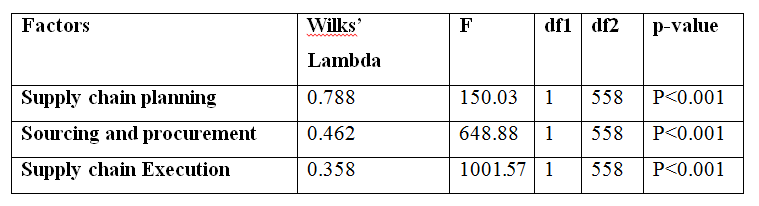
The above table shows the strong evidence of significant difference (p-value) between the means of organized and unorganized group for all independent variables namely a)supply chain planning b)sourcing and procurement and c)Supply chain execution. Further, table shows the independent variables of supply chain execution is found to be highly significant with F –value (1001.57).
Wilks’ lambda
Wilks’ Lambda is the ratio of within-groups sums of squares to the total sums of squares. This is the proportion of the total variance in the discriminant scores not explained by differences among groups. A lambda of 1.00 occurs when observed group means are equal (all the variance is explained by factors other than difference between those means), while a small lambda occurs when within-groups variability is small compared to the total variability. A small lambda indicates that group means appear to differ. The associated significance value indicates whether the difference is significant. The closer Wilks' lambda is to 0, the more the variable contributes to the discriminant function.
So we have Supply chain planning Lambda value as 0.788, Sourcing and Procurement's lambda has a value of 0.462 and for supply chain execution the value is 0.358 which are unexplained. The lambda value if small then it is an indication of great difference between the group means. Here in this work the SCP is having high Lambda value then SAP and SCE, therefore the SCP do not differ and even the F value is alos Low, however the SAP and SCE are having F value increasing and hence the difference is also significant.
Box’s test of Equality of covariance matrices:
The natural log of the determinants of each group's covariance matrix and the pooled within-group covariance. Ideally the determinants should be almost equal to one another for the assumption of equality of covariance matrices. In the above analysis it is observed as for both the groups the determinants are to some extent similar but not exact. However we can say as almost equal to one another, hence we can assume the equality of covariance matrix.
Canonical Discriminant function:
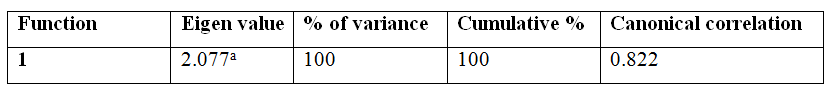
The above table displays the outputs of the eigenvalues of the discriminant functions, it also reveal the canonical correlation for the discriminant function. The larger the eigenvalue is, is is more amount of variance shared the linear combination of variables. Here in our study the value is good and more than 1 hence indicates the amount of variance shared between the variables. The rule says that cumulative values more than 90% are most important in the analysis and here we have 100% and hence the model is fit for discriminant analysis.
Standardized Canonical Coefficients
The standardized canonical discriminant coefficients can be used to rank the importance of each variable. A high standardized discriminant function coefficient might mean that the groups differ a lot on that variable
a.First 1 canonical discriminant functions were used in the analysis.
In the above table, the eigen value gives an idea of the proportion of variance explained. The canonical relation is a correlation between the discriminant scores and the levels of these dependent variables. The higher the correlations value, the better the function that discriminates the values. 1 is considered as perfect. Here, we have found the canonical correlation of 0.822 is the nearest perfect.
Further, to state that it may be a statistically significant discriminating power in the variables included in the model. Hence, we can proceed to develop the Discriminant Equation. Wilks’ lambda test of function indicates the significance of the discriminant function. The Wilk's lambda table indicates a highly significant function (p < .001) and provides the proportion of total variability not explained, i.e. it is the converse of the squared canonical correlation. So we have 32.5% unexplained. Hence our model explains the discriminate between the organized and unorganized retailers about 70% perfect.
Formulating the Discriminant Function:
The standard form of the Discriminant Function is Z = a + b1x1 + b2x2 + b3x3 Where Z is the dependent variable ‘a’ is the constant term ‘Canonical Discriminant Function Coefficient’ and b1, b2 and b3 are the corresponding un-standardized discriminant function coefficient x1, x2 and x3 are the independent variables (supply chain planning,sourcing and procurement and supply chain execution)respectively.
Fisher’s linear discriminant functions
The Fisher's linear discriminant function tableexplains the function of coefficient between organized and unorganized sector with independent variable of supply chain planning , sourcing and procurement and supply chain execution .Further, the table indicates the organized sector’s Fisher’s linear discriminant functions shows higher values than unorganized sector’s on the three independent variables in the study. Overall, the study implied that the organized sector’s closely and significantly related to supply chain planning (12.08), sourcing and procurement (25.46) and supply chain execution (10.69).
Y = -102.67+12.08 X1+25.46 X2+10.69 X3 for organized retailers.
Y= -67.17+11.00 X1+22.30 X2 +5.59 X3 for unorganized Retailers.
As per the rule if we are comparing the values between groups, the higher coefficient means the variable attributes more for that group.
Hence, significant difference can be noticed in the group variables based on independent variables and concluded that organized sector’s fit into the model of the study.
What you will get when you order for Discriminant function analysis in statistical consultation services at Stats work: Our Service description

Frequently Asked Questions
- What is the difference between factor analysis and discriminant analysis?
- Can we use discriminant analysis in qualitative data?
On which areas you provide Discriminant function analysis
We accept orders from a wide range of subjects which include Business Management, Biological sciences, Education, Psychology and Finances and so on.
What Information that I need to provide while ordering for discriminant functionstatistical analysis consultation services
The data must contain without any missing value. To match exactly with your requirement, we required title that you had already selected objectives and research questions.