
Multiple Regression Statistical Services from Experts at Stats work
Multiple regression analysis is similar to linear regression analysis since in linear regression only one independent variable and dependent variable is used.
Get the Help from Professional Statisticians & Biostatisticians
Multiple Regression Statistical Services from Experts at Stats work
Multiple regression analysis is similar to linear regression analysis since in linear regression only one independent variable and dependent variable is used. But in the multiple regression analysis, more than one independent variable and one dependent variable can be used. Both regression analyses are used to predict the value of a dependent variable based on the value of independent variable. Dependent (Predict and) variable means the variable that would get predicted and independent variable is the variable that is being used to predict the value of the dependent variable.
Multiple Regression Statistical analysis – what values can be extracted and their usage?
- R square (R2) value explains what percent of variance in the dependent variable that can be explained by the independent variable
- F-ratio in the ANOVA table tells whether the overall regression model is a good fit or not for the data
- Estimated model coefficients table contains the following estimators: Through t-value and p-value for each independent variable, we can to know whether the each independent variable is significantly predicting the dependent variable. Beta (β) coefficients are the point estimator of independent variables. This table also contains the interval estimator of independent variable
What Statistical consultation Services we offer at multiple regression analysis?
In Multiple regression analysis, our Statswork experts are excellent and result-oriented performers where our output of multiple regression analysis is in the following format. Suppose if you want to predict the yield of rice in your soil, then the factors such as rain fall, area under cultivation, amount of fertilizer and so many external factors influence the yield of rice. In this situation, yield of rice is the dependent variable and rail fall, area under cultivation, amount of fertilizer and all are the independent variables. The hypothesis should be in the following manner: Null hypothesis (H0) Independent variables do not predict the value of dependent variable; Alternative hypothesis (H1) Independent variables predict the value of dependent variable.
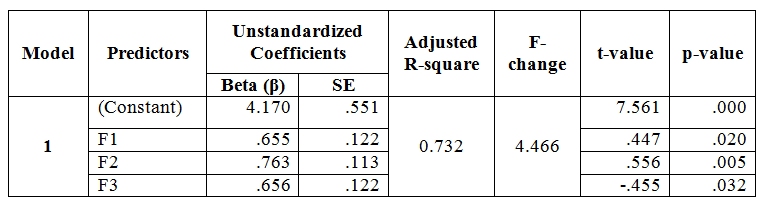
Where F1-Rain fall, F2- Area under cultivation, F3-Amount of fertilizer
Predict and variable: yield of rice
From the above table, t-value and p-value for each independent variable tells whether the model is significantly predict the dependent variable or not. In this study, all p-values are less than 0.05 which reveals that all the three factors are used to predict the yield of rice. Also the adjusted R-square value indicates 73% of variation can be explained the variance in the dependent variable that can be explained by these three factors. However, only 27% variations in the predicted value due to some other external factors like seeds’ characteristics and so on. All the estimated values (β) are positive. Hence we concluded that if there is an increase in the amount of rain fall, then the area under cultivation and fertilizers were associated with an increased likelihood of exhibiting yield of rice.
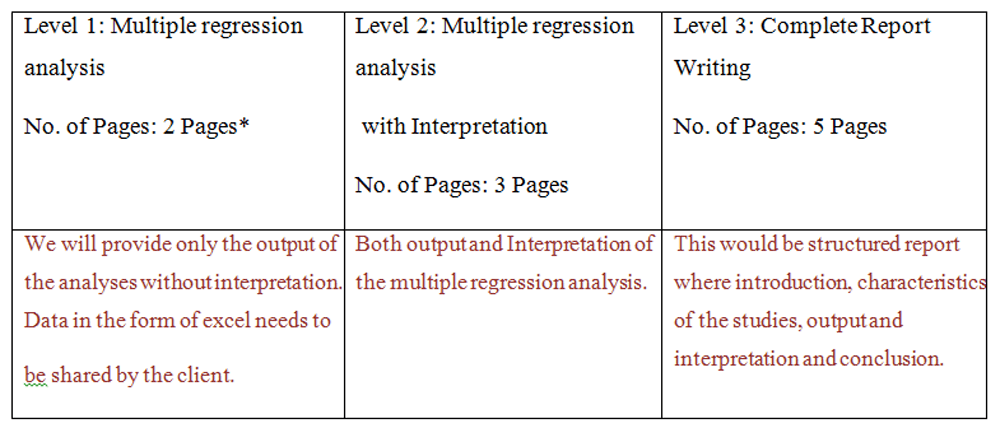
What you will get when you order for multiple regressions statistical consultation services at Stats work: Our Service description
Frequently Asked Questions
Can I know the difference between R-value and R2 value?
R-value represents the relationship between dependent and independent variable. R2 value explains what percent of variance in the dependent variable that can be explained by the independent variable.
What is beta (β) value?
Beta values are estimated values. These values are used to interpret the direction of the relationship between dependent variable and independent variable.
Can I use more than one dependent variable in multiple regression analysis?
You can’t use more than one dependent variable in multiple regression analysis.
On which areas you provide multiple regression analysis
We accept orders from a wide range of subjects which include Business Management, Economics, Epidemiology, Public Health, Life Science, and Nutrition
What Information that I need to provide while ordering for multiple regression analysisconsultation services
The data must contain without any missing value. The data may be likert scale or score values. To match exactly with your requirement, we required title that you had already selected objectives and research questions.